Fluid Visualization Of Spreadsheet Structures Page 7
ADVERTISEMENT
 1
1 2
2 3
3 4
4 5
5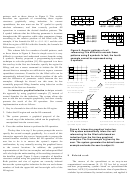 6
6 7
7 8
8to the development of interactive graphical applications.
We implemented these interaction techniques in our
NoPumpG [29] applied the idea of the spreadsheet’s
prototype spreadsheet program, and they noticeably improve
automatic maintenance of predefined relationships among
the understandability of spreadsheets. Keys to our approach
cell values to the control of graphical representations. C32
are carefully designed graphical integration of the dataflow
[19] used a spreadsheet interface for constructing constraints
information with the spreadsheet layout, animation of all
in user interface toolkits. Forms/3 [3, 10] is a general-
graphical changes, and lightweight interaction. We found
purpose visual programming language based on the
fading animations to be particularly effective—the user
spreadsheet paradigm. Yang et al. proposed design
becomes subtly aware of the existence of the hidden dataflow
benchmarks for visual programming [30] including static
graph at the position where it has faded away.
dataflow visualization.
Future work includes integration with more realistic
Toolglass and Magic Lenses [2] use spatially dedicated
spreadsheet programs. As we mentioned earlier, our
lenses to visually present and interact with the underlying
prototype spreadsheet program is written using Pad++ [1,
information layer. In contrast to a Magic Lens visualization
23] and Python running on Unix platforms. Although Pad++
of the dataflow structure of spreadsheets, fluid visualization
provides powerful scaling and animation primitives for
controls the entire space in a coordinated way, providing a
exploring novel ideas rapidly, it exacts a performance toll.
more integrated interface.
As a result, smooth animation is possible only for
Zooming interfaces [1, 24] and distortion-oriented
spreadsheets containing 400 cells or fewer. Scaling our
focus+context techniques [9, 15, 16] are efforts to present
experiences to larger spreadsheets raises three issues:
vast information spaces within a limited screen space. They
animation
performance,
algorithm
performance,
and
try to present a focal part of the information space clearly
visualization and navigation of large spreadsheet structures.
while maintaining the surrounding context. For example,
We are confident that a custom implementation would
work on visualization of spreadsheets [26, 28] use
support animation of larger spreadsheets comfortably. Our
focus+context techniques to visualize very large tabular
algorithms for supporting our various techniques rely upon
layouts. The difference is that our focus is on the
traditional dataflow computations that are computationally
visualization of the hidden dataflow structure behind the
tractable
for
larger
spreadsheets.
Visualization
and
tabular layout, and not that of the tabular layout itself.
navigation of very large spreadsheets, where cells refer to
Many modern user interface systems incorporate
distant cells outside of the boundaries of the screen, is a
animation [3, 21]. Animations can give the feeling of solidity,
more substantive issue.
We expect that animated
continuity, and real existence to visual objects. They help the
presentation and semantic navigation techniques would be
user to understand visual events by softening abrupt changes
especially useful for such spreadsheets. In these cases,
on the screen. They are indispensable tools to present a
automatic camera controls may be required, such as zooming
sequence of events in an intuitive way (i.e. algorithm
out to provide a larger context, panning to a logically-
animation [25]). In this paper, we proposed another useful
connected cell, and then zooming in to permit a closer view.
application of animation effects: animations to reify and
Fluid visualization for spreadsheets is a particular
visualize invisible information. It is difficult to present
application of our general set of fluid user interface
hidden dataflow structures with static representations.
techniques, whose goal is to provide lightweight, contextual,
Animation makes it possible to visualize these invisible
and animated access to a secondary layer of content while
structures.
maintaining the appearance of the primary material. Fluid
Our graphical induction technique can be seen as an
techniques allow the user to fluidly shift attention from
application of programming by demonstration/example
primary to secondary content, as the system fluidly alters its
techniques [7]. Metamouse [17] detects repetition in the
display to show previously hidden secondary content in the
user’s graphical editing operations and suggests the next
context of its associated primary content. Other domains in
operation. Eager [6] analyzes a sequence of HyperCard
which we have explored fluid user interfaces include
operations and suggests the next set of operations.
hypertext linking [31] and annotation [4]. Among possible
further applications of the fluid visualization techniques are
Chimera [14] and IMAGE [19] find appropriate geometric
maps, CAD diagrams, and other graphical domains with rich
constraints from given graphical examples.
underlying structures. Our experiences so far suggest that
fluid techniques can be a powerful aid to users in a wide
9 Discussion and conclusions
variety of situations that require comprehending and
interacting with data.
Spreadsheets have hidden dataflow graphs in addition to
their superficial tabular layouts. We have presented a series
References
of techniques that make the dataflow structure visible and
accessible, while maintaining the original appearance of the
1. Bederson, B.B., Hollan, J., Perlin, K., Meyer, J., Bacon, D., and
spreadsheet. The goal of these techniques is to impart a
Furnas, G., Pad++: a zoomable sketchpad for exploring
better understanding of the dataflow structure by letting the
user visually interact with these hidden structures.
ADVERTISEMENT
0 votes
Related Articles
Related forms
 Right Of Entry/hold Harmless Agreement/duplication Of Benefits Private Property Debris Removal & Demolition Of Unsafe Structures Form 2014
Legal
Right Of Entry/hold Harmless Agreement/duplication Of Benefits Private Property Debris Removal & Demolition Of Unsafe Structures Form 2014
Legal
 Right Of Entry/hold Harmless Agreement/duplication Of Benefits Private Property Debris Removal & Demolition Of Unsafe Structures Form
Business
Right Of Entry/hold Harmless Agreement/duplication Of Benefits Private Property Debris Removal & Demolition Of Unsafe Structures Form
Business


Related Categories
Parent category: Business