Reading A Line Graph - Math Worksheet With Answers
ADVERTISEMENT
 1
1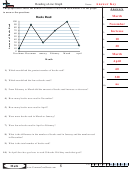 2
2Name:
Reading a Line Graph
The graph below shows the number of books a class read each month. Use the graph
A n s w e r s
to answer the questions.
March
Books Read
Books Read
1.
100
100
November
90
90
2.
80
80
70
70
Increase
3.
60
60
50
50
10
40
40
4.
30
30
20
20
20
5.
10
10
0
0
November December January
November December January
February
February
March
March
April
April
March
6.
Month
Month
April
7.
60
8.
1) Which month had the greatest number of books read?
320
9.
2) Which month had the fewest books read?
no
10.
3) From February to March did the amount of books read increase or decrease?
4) How many books were read in November?
5) How many books were read in April?
6) Were more books read in March or January?
7) Were fewer books read in April or February?
8) What is the difference in the number of books read in January and the number read
in December?
9) What is the total number of books read?
10) In April the class goal was to read 50 books. Did they reach that goal?
1-10 90 80 70 60 50 40 30 20 10 0
8
Math
ADVERTISEMENT
0 votes
Related Articles
Related forms


Related Categories
Parent category: Education