Reading A Line Graph - Math Worksheet With Answers
ADVERTISEMENT
 1
1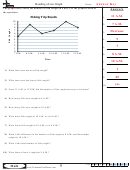 2
2Name:
Reading a Line Graph
The graph below shows the number of fish caught in a day. Use the graph to answer
A n s w e r s
the questions.
11 A.M.
Fishing Trip Results
Fishing Trip Results
1.
10
10
7 A.M.
9
9
2.
8
8
7
7
Decrease
3.
6
6
5
5
9
4
4
4.
3
3
2
2
7
5.
1
1
0
0
7 A.M.
7 A.M.
8 A.M.
8 A.M.
9 A.M.
9 A.M.
10 A.M.
10 A.M.
11 A.M.
11 A.M.
12 P.M.
12 P.M.
8 A.M.
6.
Time
Time
10 A.M.
7.
1
8.
1) What time were the most fish caught?
45
9.
2) What time were the fewest fish caught?
yes
10.
3) From 11 A.M. to 12 P.M. did the number of fish caught increase or decrease?
4) How many fish were caught at 8 A.M.?
5) How many fish were caught at 10 A.M.?
6) Were more fish caught at 10 A.M. or at 8 A.M.?
7) Were fewer fish caught at 10 A.M. or at 8 A.M.?
8) What is the difference in the number of fish caught at 9 A.M. and the number
caught at 10 A.M.?
9) What is the total number of fish caught?
10) Were there at least 4 caught at 9 A.M.?
1-10 90 80 70 60 50 40 30 20 10 0
9
Math
ADVERTISEMENT
0 votes
Related Articles
Related forms


Related Categories
Parent category: Education