Creating Tables And Graphs Of Ratios Worksheet Template With Answer Key
ADVERTISEMENT
 1
1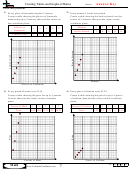 2
2Creating Tables and Graphs of Ratios
Name:
Solve each problem.
1) Every glass of lemonade requires 3 lemons.
2) Every minute 3 books are printed.
Create a table showing the glasses of lemonade
Create a table showing the books printed over the
made using up to 5 lemons, then plot the values on
course of 5 minutes, then plot the values on the
the coordinate plane.
coordinate plane.
Glasses of
Minutes
1
2
3
4
5
1
2
3
4
5
Lemonade
Books Printed
3
6
9
12
15
Lemons Used
3
6
9
12
15
Minutes
Glasses of Lemonade
3) Every pound of meat costs $5.25.
4) Every piece of chicken costs $1.25.
Create a table showing the price for up to 5 pounds
Create a table showing the price for up to 5 pieces
of meat, then plot the values on the coordinate
of chicken, then plot the values on the coordinate
plane.
plane.
Pounds of Meat
1
2
3
4
5
Pieces of Chicken
1
2
3
4
5
Price
5.25 10.5 15.75 21 26.25
Price
1.25 2.5 3.75
5
6.25
Pounds of Meat
Pieces of Chicken
1-4
75 50 25 0
7
Math
ADVERTISEMENT
0 votes
Related Articles
Related forms


Related Categories
Parent category: Education