Creating Tables And Graphs Of Ratios Worksheet Template With Answer Key
ADVERTISEMENT
 1
1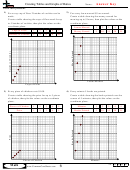 2
2Creating Tables and Graphs of Ratios
Name:
Solve each problem.
1) For every cup of flour 2 batches of cookies can be
2) For every lawn mowed $5 are earned.
made.
Create a table showing the money earned for
Create a table showing the cups of flour need for up
mowing up to 5 lawns, then plot the values on the
to 5 batches of cookies, then plot the values on the
coordinate plane.
coordinate plane.
Lawns Mowed
1
2
3
4
5
Cups of Flour
1
2
3
4
5
Money Earned
5
10
15
20
25
Batches of Cookies
2
4
6
8
10
Lawns Mowed
Cups of Flour
3) Every piece of chicken costs $1.00.
4) Every minute 5 books are printed.
Create a table showing the price for up to 5 pieces
Create a table showing the books printed over the
of chicken, then plot the values on the coordinate
course of 5 minutes, then plot the values on the
plane.
coordinate plane.
Pieces of Chicken
1
2
3
4
5
Minutes
1
2
3
4
5
Price
1
2
3
4
5
Books Printed
5
10
15
20
25
Pieces of Chicken
Minutes
1-4
75 50 25 0
6
Math
ADVERTISEMENT
0 votes
Related Articles
Related forms


Related Categories
Parent category: Education