Creating Tables And Graphs Of Ratios Worksheet Template With Answer Key
ADVERTISEMENT
 1
1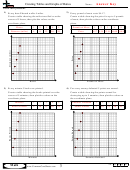 2
2Creating Tables and Graphs of Ratios
Name:
Solve each problem.
1) Every hour Edward walks 4 miles.
2) Every pound of meat costs $4.17.
Create a table showing the miles travelled over the
Create a table showing the price for up to 5 pounds
course of 5 hours, then plot the values on the
of meat, then plot the values on the coordinate
coordinate plane.
plane.
Hours
1
2
3
4
5
Pounds of Meat
1
2
3
4
5
Distance (miles)
4
8
12
16
20
Price
4.17 8.34 12.51 16.68 20.85
Hours
Pounds of Meat
3) Every minute 5 books are printed.
4) For every enemy defeated 5 points are earned.
Create a table showing the books printed over the
Create a table showing the points earned for
course of 5 minutes, then plot the values on the
destroying up to 5 enemies, then plot the values on
coordinate plane.
the coordinate plane.
Minutes
1
2
3
4
5
Enemies Defeated
1
2
3
4
5
Books Printed
5
10
15
20
25
Points Earned
5
10
15
20
25
Minutes
Enemies Defeated
1-4
75 50 25 0
3
Math
ADVERTISEMENT
0 votes
Related Articles
Related forms


Related Categories
Parent category: Education