Creating Tables And Graphs Of Ratios Worksheet Template With Answer Key
ADVERTISEMENT
 1
1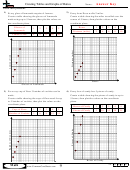 2
2Creating Tables and Graphs of Ratios
Name:
Solve each problem.
1) Every glass of lemonade requires 4 lemons.
2) Every hour Dave walks 2 miles.
Create a table showing the glasses of lemonade
Create a table showing the miles travelled over the
made using up to 5 lemons, then plot the values on
course of 5 hours, then plot the values on the
the coordinate plane.
coordinate plane.
Glasses of
Hours
1
2
3
4
5
1
2
3
4
5
Lemonade
Distance (miles)
2
4
6
8
10
Lemons Used
4
8
12
16
20
Hours
Glasses of Lemonade
3) For every cup of flour 3 batches of cookies can be
4) Every box of candy has 5 pieces of candy.
made.
Create a table showing the pieces of candy in up to
Create a table showing the cups of flour need for up
5 boxes, then plot the values on the coordinate
to 5 batches of cookies, then plot the values on the
plane.
coordinate plane.
Boxes of Candy
1
2
3
4
5
Cups of Flour
1
2
3
4
5
Pieces of Candy
5
10
15
20
25
Batches of Cookies
3
6
9
12
15
Boxes of Candy
Cups of Flour
1-4
75 50 25 0
9
Math
ADVERTISEMENT
0 votes
Related Articles
Related forms


Related Categories
Parent category: Education