Creating Tables And Graphs Of Ratios Worksheet Template With Answer Key
ADVERTISEMENT
 1
1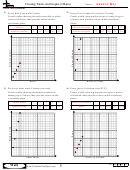 2
2Creating Tables and Graphs of Ratios
Name:
Solve each problem.
1) Every hour Tom walks 2 miles.
2) Every box of candy has 6 pieces of candy.
Create a table showing the miles travelled over the
Create a table showing the pieces of candy in up to
course of 5 hours, then plot the values on the
5 boxes, then plot the values on the coordinate
coordinate plane.
plane.
Hours
1
2
3
4
5
Boxes of Candy
1
2
3
4
5
Distance (miles)
2
4
6
8
10
Pieces of Candy
6
12
18
24
30
Hours
Boxes of Candy
3) For every shirts made 5 buttons are used.
4) Every piece of chicken costs $2.25.
Create a table showing the buttons needed for
Create a table showing the price for up to 5 pieces
making up to 5 shirts, then plot the values on the
of chicken, then plot the values on the coordinate
coordinate plane.
plane.
Shirts Made
1
2
3
4
5
Pieces of Chicken
1
2
3
4
5
Buttons Used
5
10
15
20
25
Price
2.25 4.5 6.75
9
11.25
Shirts Made
Pieces of Chicken
1-4
75 50 25 0
5
Math
ADVERTISEMENT
0 votes
Related Articles
Related forms


Related Categories
Parent category: Education