Analyzing Graphs Worksheet For Children With Answers
ADVERTISEMENT
 1
1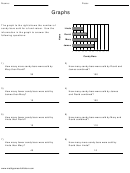 2
2Name:
Date:
Graphs
The graph to the right shows the number of
Linda
candy bars sold for a fund-raiser. Use the
information in the graph to answer the
David
following questions:
Mary
James
0 10 20 30 40 50 60 70 80 90 100
Candy Bars
1)
2)
How many more candy bars were sold by
How many candy bars were sold by David and
Mary than David?
James combined?
3)
4)
How many fewer candy bars were sold by
How many candy bars were sold by James
James than Mary?
and David combined?
5)
6)
How many fewer candy bars were sold by
How many candy bars were sold by Mary and
Linda than David?
David combined?
7)
8)
How many fewer candy bars were sold by
How many more candy bars were sold by
Linda than Mary?
David than Linda?
ADVERTISEMENT
0 votes
Related Articles
Related forms


Related Categories
Parent category: Education