Analyzing Graphs Worksheet With Answers
ADVERTISEMENT
 1
1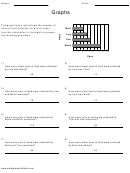 2
2Name:
Date:
Graphs
The graph to the right shows the number of
Mark
cans of food collected for a fund-raiser.
Use the information in the graph to answer
Lisa
the following questions:
Tom
Maria
0 10 20 30 40 50 60 70 80 90 100
Cans
1)
2)
How many fewer cans of food were collected
How many fewer cans of food were collected
by Lisa than Maria?
by Lisa than Tom?
3)
4)
How many cans of food were collected by Lisa
How many more cans of food were collected
and Mark combined?
by Lisa than Mark?
5)
6)
How many cans of food were collected by
How many cans of food were collected by
Maria and Mark combined?
Tom and Lisa combined?
7)
8)
How many cans of food were collected by
How many fewer cans of food were collected
Mark and Tom combined?
by Mark than Maria?
ADVERTISEMENT
0 votes
Related Articles
Related forms


Related Categories
Parent category: Education