Pictograms, Pie Charts, Stem And Leaf, Frequency Polygons Revison Worksheet
ADVERTISEMENT
 1
1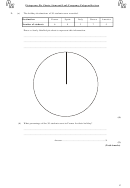 2
2 3
3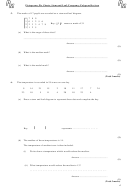 4
4 5
5 6
6Pictograms, Pie Charts, Stem and Leaf, Frequency Polygons Revison
1.
The pictogram shows the number of different birds that visited a bird table in one hour.
Key
represents 2 birds
Sparrow
Starling
Thrush
Blackbird
Robin
(a)
How many sparrows visited the table?
……………………………………………………………………………………….
Answer ……………………………………………………
(2)
(b) Five robins visited the table. Fill in the pictogram to show this number.
(2)
(c)
How many more thrushes than blackbirds visited the table?
……………………………………………………………………………………….
Answer ……………………………………………………
(2)
(Total 6 marks)
1
ADVERTISEMENT
0 votes
Related Articles
Related forms


Related Categories
Parent category: Education