Gre Math Review #8 Worksheet With Answer Key
ADVERTISEMENT
 1
1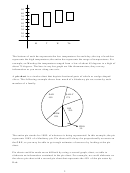 2
2 3
3 4
4 5
5GRE MATH REVIEW #8
Charts and Tables
These questions test your ability to read and interpret charts and graphs. The mathematics
involved in these questions is nothing more than percentages, ratios, averages, etc. So, if
you remember our review on these topics, this section should not be difficult for you.
Most students, however, are careless in reading the questions and interpreting the charts
rather than with the calculations. In the following discussion, we’ll review the types of
graphs and charts used on the GRE before working examples.
A grid graph is very similar to the Cartesian coordinate system. The following grid
graph depicts the relationship between a person’s age and his/her height:
Height in Inches
90
80
70
60
50
40
30
20
10
2 4 6 8 10 12 14 16
Age in Years
The vertical axis represents height; the horizontal represents age; the plotted curve
represents the relationship between them. This graph tells a person’s age at any height or
a person’s height at any age. For example, the point on the curve shows us that at age 15,
the person was 70 inches tall.
A bar graph is a lot like a grid graph. The following example shows the range in
temperature during four consecutive days:
ADVERTISEMENT
0 votes
Related Articles
Related forms


Related Categories
Parent category: Education