Statistics Worksheet
ADVERTISEMENT
 1
1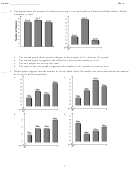 2
2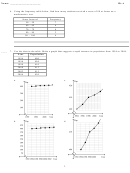 3
3 4
4 5
5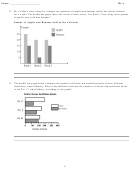 6
6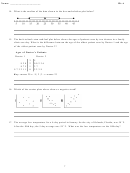 7
7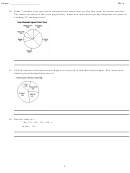 8
8 9
9Name: ______________________ Class Period: _________________ Seat #: _________
ID: A
Algebra 1: Statistics
____
1. The graphs below show the number of honor-roll students in each grade at Ferndale Middle School.
Which statement is true?
a.
The two graphs are exactly the same.
b.
The two graphs use completely different data.
c.
The scale on the second graph does not distort the lengths of the bars.
d.
The scale on the first graph gives the most accurate picture of the relative number of
honor-roll students for each class.
____
2. The graphs below represent the average number of rentals each day of the year at Shadydeal Videos.
Which statement is true?
a.
The vertical scale on the first graph is misleading because it starts at zero.
b.
The horizontal scales on both graphs are misleading because the odd-numbered years
are not clearly labeled.
c.
The second graph exaggerates the change from year to year.
d.
none of these
____
3. The stem-and-leaf plot below could NOT represent which of the following?
1
1 2 2 7 7
2
1 4 4 7
3
3 5 6 8 9
Key: 3 | 2 means 3.2
a.
the average number inches of rain in June
b.
the height of plant seedlings, in inches
c.
the weight of phonebooks, in pounds
d.
the height of NBA basketball players, in meters
1
ADVERTISEMENT
0 votes
Related Articles
Related forms


Related Categories
Parent category: Education