Lesson 3.3, 3.4, And 3.5: Adding, Subtracting, And Multiplying Integers Worksheet Page 11
ADVERTISEMENT
 1
1 2
2 3
3 4
4 5
5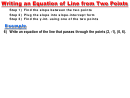 6
6 7
7 8
8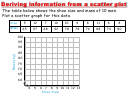 9
9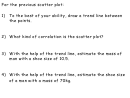 10
10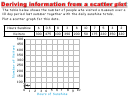 11
11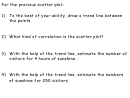 12
12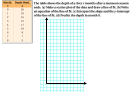 13
13Deriving information from a scatter plot
The table below shows the number of people who visited a museum over a
10 day period last summer together with the daily sunshine totals.
Plot a scatter graph for this data.
Hours Sunshine
6
0.5
8
3
8
10
7
5
3
2
Visitors
300
475
100
390
200
50
175
220
350
320
500
450
400
350
300
250
200
150
100
0
2 3 4 5 6 7
8 9 10
1
Hours of Sunshine
ADVERTISEMENT
0 votes
Related Articles
Related forms


Related Categories
Parent category: Education