Lesson 3.3, 3.4, And 3.5: Adding, Subtracting, And Multiplying Integers Worksheet Page 12
ADVERTISEMENT
 1
1 2
2 3
3 4
4 5
5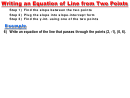 6
6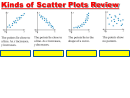 7
7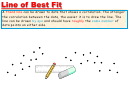 8
8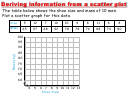 9
9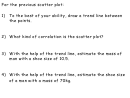 10
10 11
11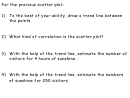 12
12 13
13For the previous scatter plot:
1) To the best of your ability, draw a trend line between
the points.
2) What kind of correlation is the scatter plot?
3) With the help of the trend line, estimate the number of
visitors for 4 hours of sunshine .
4) With the help of the trend line, estimate the numbers
of sunshine for 250 visitors.
ADVERTISEMENT
0 votes
Related Articles
Related forms


Related Categories
Parent category: Education