Lesson 3.3, 3.4, And 3.5: Adding, Subtracting, And Multiplying Integers Worksheet Page 8
ADVERTISEMENT
 1
1 2
2 3
3 4
4 5
5 6
6 7
7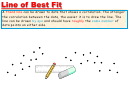 8
8 9
9 10
10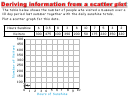 11
11 12
12 13
13Line of Best Fit
A
trend line
can be drawn to data that shows a correlation. The stronger
the correlation between the data, the easier it is to draw the line. The
line can be drawn
by eye
and should have
roughly
the
same number
of
data points on either side.
ADVERTISEMENT
0 votes
Related Articles
Related forms


Related Categories
Parent category: Education