Lesson 3.3, 3.4, And 3.5: Adding, Subtracting, And Multiplying Integers Worksheet Page 9
ADVERTISEMENT
 1
1 2
2 3
3 4
4 5
5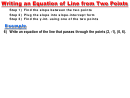 6
6 7
7 8
8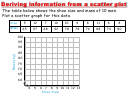 9
9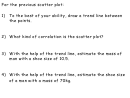 10
10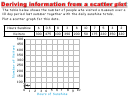 11
11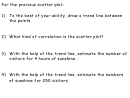 12
12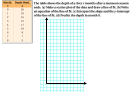 13
13Deriving information from a scatter plot
The table below shows the shoe size and mass of 10 men.
Plot a scatter graph for this data.
Size
5
12
7
10
10
9
8
11
6
8
Mass
65
97
68
92
78
78
76
88
74
80
100
95
90
85
80
75
70
65
60
4 5 6 7 8 9 10 11 12 13
Shoe Size
ADVERTISEMENT
0 votes
Related Articles
Related forms


Related Categories
Parent category: Education