Handling Data Worksheet With Answers - S A Lomax - 2006
ADVERTISEMENT
 1
1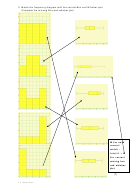 2
2 3
3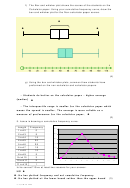 4
4 5
5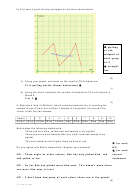 6
6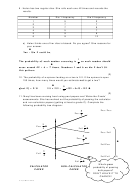 7
7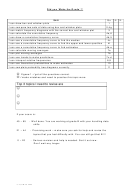 8
8MAKE THE
GRADE
HANDLING
DATA
ANSWERS = 1 mark
1. Using the Box and Whisker Plot, complete the table:
Minimum
Lower
Median
Interquartile
Upper
Maximum
Range
value
Quartile
Range
Quartile
value
4
7
8
5
12
15
11
(5)
2. Bob and Mary are driving instructors. The number of minor errors made by
their students in the driving test are shown in the box and whisker plots below:
Bob
Mary
a) Who is the best driving instructor? Give reasons for your answer.
Mary because:
- her students make on average fewer minor mistakes (lower median)
- even though the interquartile ranges are the same (7), her range
(11) is lower than Bob’s (13) meaning there is a smaller spread in her
results. Mary’s average is more reliable as a measure of performance
(or similar - for mentioning average and for describing the
‘spread’)
(3)
b) What percentage of Mary’s students had ten or more minor errors?
25%
(1)
S A LOMAX 2006
ADVERTISEMENT
0 votes
Related Articles
Related forms


Related Categories
Parent category: Education