2.1 Tally Charts And Frequency Tables Worksheet
ADVERTISEMENT
 1
1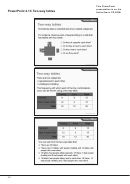 2
2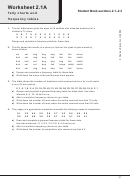 3
3 4
4 5
5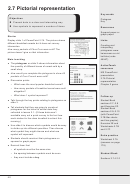 6
6 7
7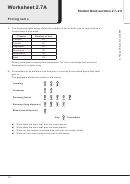 8
8 9
9 10
10 11
11 12
12 13
13 14
14 15
15 16
16 17
17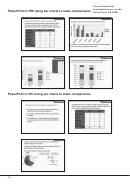 18
18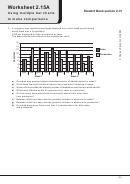 19
19 20
20 21
21 22
22 23
23 24
24 25
25 26
26 27
272.1 Tally charts and frequency tables
Key words
Objectives
Tally chart
Frequency table
●
Tally raw data using a standard tally chart
Cumulative
●
Construct frequency tables
frequency
Starter
Ask each student how they travelled to school and record the data as a list on
the board.
Links
Collecting Data
Main teaching
co.uk/hotlinks (code
●
Show the list of ‘travel to school’ data on slide 1 of
4554T)
PowerPoint 2.1A.
ActiveTeach
●
How many people travelled by bus? How easy was
resources
it to answer the question quickly?
●
MS PowerPoint
Discuss why a simple list is inefficient.
presentations:
●
How could you sort this ‘travel to school’ list into a
2.1A Travel to
more sensible and useable form? Establish that a
school, and
tally would be useful and demonstrate constructing
2.1B Cumulative
one using slide 2.
frequency
●
Discussion points
Chapter 2 game
○
Why might you use a tally?
○
Why does the table include a frequency column?
Follow up
○
Why might you be interested in the total
Student Book
frequency? (Number of students who took part)
sections 2.1–2.3
and Exercise 2A
●
As a class, complete the frequency table on slide
Student Book
3 with each person’s mode of transport to school
sections 2.4–2.5
today.
(with PowerPoint
●
Display slide 1 of PowerPoint 2.1B and work
2.1C), Exercise 2B
PowerPoint 2.1A
through the example with students, inviting them
and Worksheets
to calculate each cumulative frequency before
2.1B and 2.1C
revealing the answer.
Student Book
●
Tell students they will be working in pairs to
section 2.6 and
construct a data collection sheet to record numbers
Exercise 2C
of brothers and sisters.
Extra practice
●
Collect data from the whole class with students
using their own data collection sheets.
Worksheet 2.1A
(answers on page
●
Students then complete a cumulative frequency
179)
table.
PowerPoint 2.1B
●
What information can the cumulative frequency
table give which is not easily seen using the
Student Book
frequency table?
Sections 2.1–2.6
35
ADVERTISEMENT
0 votes
Related Articles
Related forms


 - 1ma0 Frequency Tables Worksheet - Edexcel Gcse")


Related Categories
Parent category: Education