Organize, Display, And Interpret Data Worksheet - Chapter 3
ADVERTISEMENT
 1
1 2
2 3
3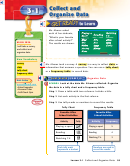 4
4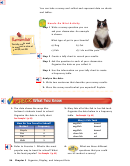 5
5 6
6 7
7 8
8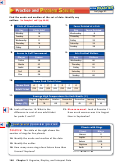 9
9 10
10 11
11 12
12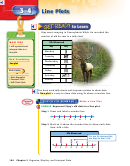 13
13 14
14 15
15 16
16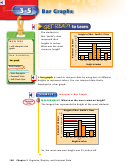 17
17 18
18 19
19 20
20 21
21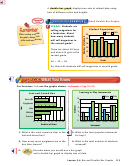 22
22 23
23 24
24 25
25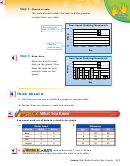 26
26 27
27 28
28 29
29 30
30 31
31 32
32 33
33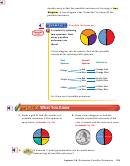 34
34 35
35 36
36 37
37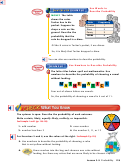 38
38 39
39 40
40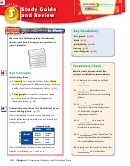 41
41 42
42 43
43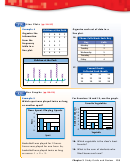 44
44 45
45 46
46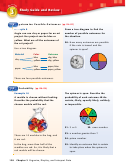 47
47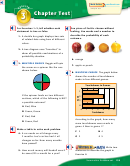 48
48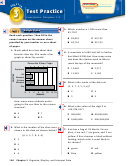 49
49 50
50Organize,
3
Display, and
Interpret Data
What are data and graphs?
Data is a set of information. When data is displayed in
a graph , it is easier to read and interpret.
Example
The graph shows the number of children in the
United States. About 35 million children are 5 to 13 years old.
Population of Kids
40
30
20
10
0
Under 5
5–13
14–17
Age
Source: U.S. Census Bureau
What will I learn in this chapter?
Collect and represent data on a number line, and in
■
graphs, tables, and charts.
Read and interpret data.
■
Determine all possible outcomes of a situation.
■
Solve problems by making a table.
■
Key Vocabulary
data
probability
survey
tree diagram
bar graph
Student Study Tools
Student Study Tools
Student Study Tools
Math Online
Math Online
Math Online
at
at at
92 Chapter 3 Organize, Display, and Interpret Data
ADVERTISEMENT
0 votes
Related Articles
Related forms


 Worksheet - Chapter 3")


Related Categories
Parent category: Education