3.1 Quadratic Functions Examples And Worksheet - Chapter 3: Polynomial And Rational Functions
ADVERTISEMENT
 1
1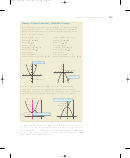 2
2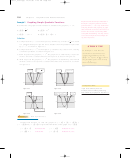 3
3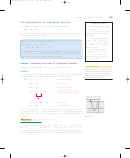 4
4 5
5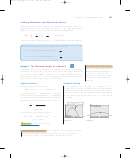 6
6 7
7 8
8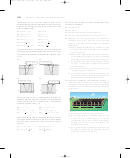 9
9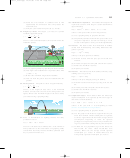 10
10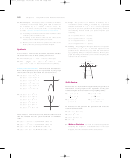 11
11333371_0301.qxp
12/27/06
1:20 PM
Page 252
252
Chapter 3
Polynomial and Rational Functions
3.1
Quadratic Functions
What you should learn
The Graph of a Quadratic Function
Analyze graphs of quadratic functions.
In this and the next section, you will study the graphs of polynomial functions.
Write quadratic functions in standard
form and use the results to sketch graphs
of functions.
Definition of Polynomial Function
Find minimum and maximum values
of quadratic functions in real-life
Let be a nonnegative integer and let
n
a
,
a
, . . . , a
, a
, a
be real
n
n
1
2
1
0
applications.
numbers with
a
0.
The function given by
n
Why you should learn it
. . .
n
n
1
2
f x
a
x
a
x
a
x
a
x
a
n
n
1
2
1
0
Quadratic functions can be used to model
is called a polynomial function in
x
of degree n.
the design of a room. For instance, Exercise 53
on page 260 shows how the size of an indoor
fitness room with a running track can be
modeled.
Polynomial functions are classified by degree. For instance, the polynomial
function
f x
a
Constant function
has degree 0 and is called a constant function. In Chapter 1, you learned that the
graph of this type of function is a horizontal line. The polynomial function
f x
mx
b,
m
0
Linear function
has degree 1 and is called a linear function. You also learned in Chapter 1 that
the graph of the linear function
f x
mx
b
is a line whose slope is
m
and
whose -intercept is
y
0, b .
In this section, you will study second-degree polyno-
mial functions, which are called quadratic functions.
Dwight Cendrowski
Definition of Quadratic Function
Let
a, b,
and be real numbers with
c
a
0.
The function given by
2
f x
ax
bx
c
Quadratic function
is called a quadratic function.
t
h
Often real-life data can be modeled by quadratic functions. For instance, the
0
6
table at the right shows the height (in feet) of a projectile fired from a height of
h
2
454
6 feet with an initial velocity of 256 feet per second at any time (in seconds). A
t
2
quadratic model for the data in the table is
h t
16t
256t
6
for
4
774
0 ≤ t ≤ 16.
6
966
The graph of a quadratic function is a special type of U-shaped curve called
8
1030
a parabola. Parabolas occur in many real-life applications, especially those
10
966
involving reflective properties, such as satellite dishes or flashlight reflectors.
You will study these properties in a later chapter.
12
774
All parabolas are symmetric with respect to a line called the axis of
14
454
symmetry, or simply the axis of the parabola. The point where the axis intersects
16
6
the parabola is called the vertex of the parabola.
ADVERTISEMENT
0 votes
Related Articles
Related forms


Related Categories
Parent category: Education