Equations And Inequalities Cumulative Review Worksheet With Answers - Nj Center For Teaching And Learning Page 2
ADVERTISEMENT
 1
1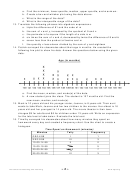 2
2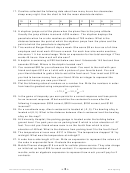 3
3 4
4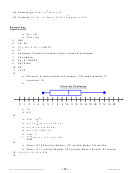 5
5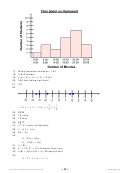 6
6 7
7a. Find the minimum, lower quartile, median, upper quartile, and maximum.
b. Create a box-and-whisker plot using the data above.
c. What is the range of the data?
d. What is the interquartile range of the data?
13. Translate the following phrases into algebraic expressions.
a. triple the difference of 81 and the cube of m
b. the sum of x and y, increased by the quotient of 9 and n
c. the perimeter of a square if the length of a side is w
d. six times the sum of c and d, decreased by twice the difference of 8 and b
e. seven less than the product of twelve and m
f. the quantity x less eleven divided by the sum of y and eighteen
14. Patrick surveyed his classmates about their age in months. He created the
following line plot to show his data. Answer the questions below using the given
data.
Age (in months)
a. Find the mean, median, and mode(s) of the data.
b. A new student joins the class. The student is 137 months old. Find the
new mean, median, and mode(s).
15. Mark is 10 years old and his younger sister, Joanne, is 8 years old. Their aunt
wants to take Mark, Joanne and her two children to the movies. Her oldest is 16
years old and her youngest is 14 years old. The movie theater in their town
charges $9 for adults and $6 for children under 13 years old. Write an expression
for the total cost of admission. Evaluate the total cost.
16. Timothy surveyed his classmates about how many minutes they spent on
homework every day and created a frequency chart. Use the chart to create a
histogram.
Time Spent on Homework (minutes)
Minutes
Tally
Frequency
0:00-4:59
I
1
5:00-9:59
III
3
10:00-14:59
II
2
15:00-19:59
IIII
5
20:00-24:59
IIII II
7
25:00-29:59
III
3
~ 2 ~
NJ Center for Teaching and Learning
ADVERTISEMENT
0 votes
Related Articles
Related forms


 Worksheet With Answer Key")


 Worksheets With Answer Key")

Related Categories
Parent category: Education