Data Collection Form Worksheet - Northern Oklahoma College
ADVERTISEMENT
 1
1 2
2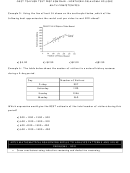 3
3 4
4 5
5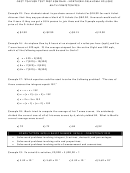 6
6 7
7 8
8 9
9 10
10 11
11OGET TEACHER TEST PREP SEMINAR – NORTHERN OKLAHOMA COLLEGE
MATH COMPETENCIES
DATA INTERPRETATION AND ANALYSIS – COMPETENCY 0009
Interpret information from line graphs, bar graphs, and pie charts.
Interpret data from tables.
Recognize appropriate representations of various data in graphic form.
Example 1: The table below shows the distribution of students’ major areas of study in a
particular college. Which of the following pie charts could be used to represent this data?
Example 2: Daniel has recorded the following data for his basketball team.
Player
Number of Shots Made
Number of Shots Attempted
Sarah
3
5
Jill
8
9
Maria
2
3
Brook
1
2
For each player, make a fraction by putting the number of shots made over the number of shots
attempted. Find the player with the best shooting record by ordering these fractions from
greatest to least.
a) Sarah
b) Jill
c) Maria
d) Brook
ADVERTISEMENT
0 votes
Related Articles
Related forms


")


Related Categories
Parent category: Business