Reading A Pie Graph Math Worksheet With Answers
ADVERTISEMENT
 1
1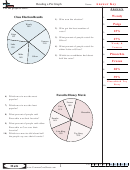 2
2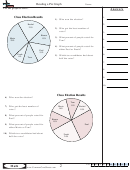 3
3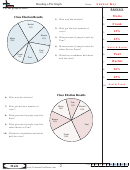 4
4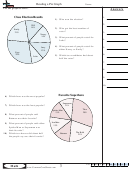 5
5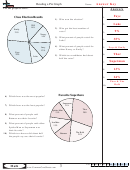 6
6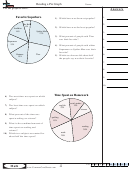 7
7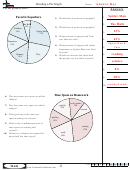 8
8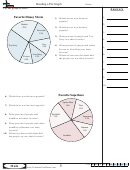 9
9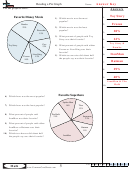 10
10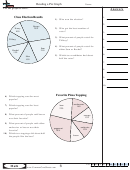 11
11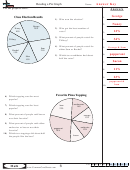 12
12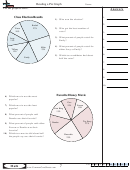 13
13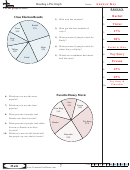 14
14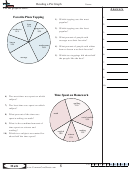 15
15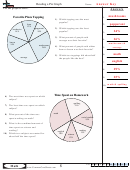 16
16 17
17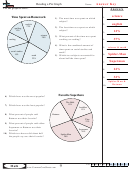 18
18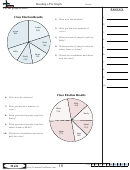 19
19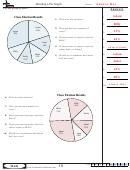 20
20Name:
Reading a Pie Graph
Use the graph to solve.
A n s w e r s
Wendy
Class Election Results
1.
1) Who won the election?
Paige
Wendy
2.
29%
2) Who got the least number of
15%
votes?
3.
Paige
9%
3) What percent of people voted for
27%
4.
Oliver?
Vanessa
Wendy &
21%
Luke
4) What percent of people voted for
Vanessa
12%
5.
either Luke or Oliver?
Pinocchio
Mike
6.
5) Which two candidates had about
Oliver
14%
half the votes?
Frozen
7.
28%
8.
39%
9.
Pinocchio & Toy
Story
10.
Favorite Disney Movie
6) Which movie was the most
popular?
Frozen
10%
7) Which movie was the least
Cars
popular?
11%
Pinocchio
8) What percent of people said
Pinocchio was their favorite?
Dumbo
14%
9) What percent of people said either
Pinocchio or Cars was their
favorite?
Lion King
Toy Story
10) Which two movies did about half
15%
22%
the people say was their favorite?
1-10 90 80 70 60 50 40 30 20 10 0
1
Math
ADVERTISEMENT
0 votes
Related Articles
Related forms


Related Categories
Parent category: Education