Graphing Unit Math Worksheet - 3rd Grade, Charlotte Mecklenburg Schools, 2010-2011
ADVERTISEMENT
 1
1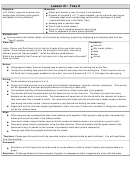 2
2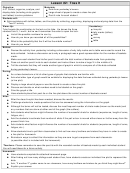 3
3 4
4 5
5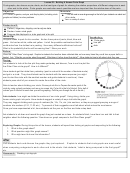 6
6 7
7 8
8 9
9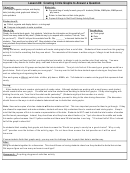 10
10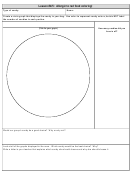 11
11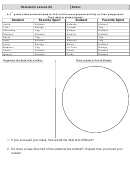 12
12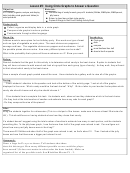 13
13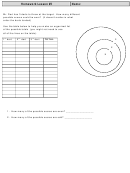 14
14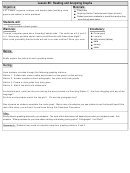 15
15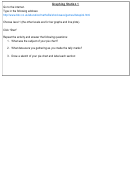 16
16 17
17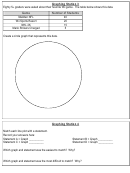 18
18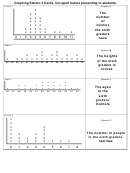 19
19 20
20 21
21 22
223
Grade Graphing Unit
2010-2011 Charlotte Mecklenburg Schools
rd
The following unit contains lessons, activities, and an assessment. Although the majority of this unit
is based upon objective 4.01 (Collect, organize, analyze, and display data (including circle graphs
and tables) to solve problems) warm-ups and assessment items have been included for objectives
4.02 (Determine the number of permutations and combinations of up to three items) and 4.03 (Solve
probability problems using permutations and combinations.)
Assessment: You will find an assessment included with this unit. Research has shown that delayed
assessment (or assessments that test residual learning) are the best indicators of student
understanding. Therefore, you may want to postpone giving the assessment until after you have
completed several weeks of follow-up activities.
In addition, observing students as they work (ongoing assessment) will provide a closer look at what
students clearly understand, as well as concepts they are still working on. A key part of ongoing
assessment is feedback. Students should receive feedback that will help them develop their
understanding.
Objective: 4.01 Collect, organize, analyze, and display data (including circle graphs and tables) to
solve problems
Students need to learn to…
To read and create circle graphs; You can review tallies, line plots and pictographs from the 1st-2
grade
nd
objectives, but spend minimal time on this. Your main focus in 3rd grade is circle graphs. You do not need to teach
bar graphs, line graphs, or stem-and-leaf graphs. All of these are 4th and 5
grade objectives.
th
• The purpose of a circle graph is to compare the parts to the whole.
• All graphs have a title that describes the main idea of the graph
• Circle graphs are sometimes called pie charts since it they look like a pie that has been cut into various slices.
• The sections of the circle graph describe the various objects/people. The larger the section, the more objects/people
being described.
• That each object/person received the same portion of the circle and that the entire circle describes the whole group.
• To recognize sections of a circle graph as half, less/more than half, less/more than a quarter, etc.
The students should be able to describe the graph with comments such as more than half the people like… or half the
students ate….or less than a quarter of the group found…etc. The students are not expected to label the sections
with percentages.
Students should be able to describe the shape of the data. Is most of the data centered in one place? What does it
tell you? Is there a trend? What does the information say about the people/items surveyed? Does the information tell
you something different if you group the data in a different manner?
Warm-Ups and Assessment items have been provided for the following objectives:
4.02 (Determine the number of permutations and combinations of up to three items)
4.03 (Solve probability problems using permutations and combinations.)
ADVERTISEMENT
0 votes
Related Articles
Related forms
")


Related Categories
Parent category: Education