Graphing And Analyzing Data Worksheet With Answers
ADVERTISEMENT
 1
1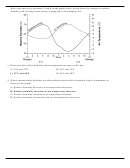 2
2 3
3 4
4 5
5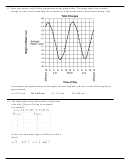 6
6 7
7 8
8 9
9 10
10 11
11 12
12Name: __________________
Graphing and Analyzing Data
Date: _______________
Base your answers to questions 1 and 2 on the graph below, which shows the water levels of ocean
tides measured in Boston, Massachusetts, for a 2-day period.
1. The graph shows that high tides at Boston occur approximately every
A) 3.5 hours
B) 6.0 hours
C) 12.5 hours
D) 16.0 hours
2. If the trends shown by the graph continue, which statement best describes the next low tide at
Boston that is expected to occur on Wednesday?
A) It will occur about 3 a.m. with a 0.4-meter water level.
B) It will occur about 6 a.m. with a 0.6-meter water level.
C) It will occur about 9 p.m. with a 2.6-meter water level.
D) It will occur about 10 p.m. with a 2.8-meter water level.
ADVERTISEMENT
0 votes
Related Articles
Related forms


Related Categories
Parent category: Education