Graphing Linear Functions Worksheet With Answer - Algebra I Practice Cc.a.ced.2
ADVERTISEMENT
 1
1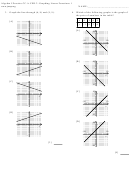 2
2 3
3Algebra I Practice CC.A.CED.2: Graphing Linear Functions 1
NAME:_____________________________
2. Which of the following represents the graph
CCSS.A.CED.2: Create equations in two or more
4
variables to represent relationships between
of a line with y-intercept 7 and slope of
?
quantities; graph equations on coordinate axes with
7
labels and scales.
[A]
1. A line goes through the point (1, 3) and has
y
5
slope
. Graph this line.
3
x
[A]
y
[B]
x
y
x
[B]
y
[C]
x
y
x
[C]
y
[D]
x
y
x
[D]
y
[2]
x
[1]
ADVERTISEMENT
0 votes
Related Articles
Related forms


Related Categories
Parent category: Education