Graphs Worksheet With Answer Key
ADVERTISEMENT
 1
1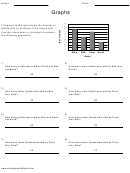 2
2Name:
Date:
Graphs
100
The graph to the right shows the number of
90
tickets sold by students in the drama club.
80
Use the information in the graph to answer
70
60
the following questions:
50
40
30
20
10
0
Alice
Bob
Carol
David
Name
1)
2)
How many tickets were sold by David and Bob
How many more tickets were sold by Bob than
combined?
David?
3)
4)
How many fewer tickets were sold by Bob
How many more tickets were sold by Carol
than Alice?
than Bob?
5)
6)
How many tickets were sold by Bob and David
How many fewer tickets were sold by David
combined?
than Bob?
7)
8)
How many fewer tickets were sold by David
How many fewer tickets were sold by Carol
than Carol?
than Alice?
ADVERTISEMENT
0 votes
Related Articles
Related forms


Related Categories
Parent category: Education