Easter Bar Graph - (D) Worksheet With Answer Key
ADVERTISEMENT
 Worksheet With Answer Key Printable pdf") 1
1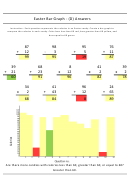 2
2Easter Bar Graph - (D)
Instruction : Each question represents the calories in an Easter candy. Create a bar graph to
compare the calories in each candy. Color bars less than 60 red, bars greater than 60 yellow, and
bars equal to 60 green.
87
98
95
76
+
12
-
3
÷
5
+
11
39
68
8
41
39
+
21
+
23
x
12
x
2
x
2
34
41
96
24
x
2
+
43
÷
12
+
65
Question no.
Are there more candies with calories less than 60, greater than 60, or equal to 60?
Happy Easter from Math-Drills.Com!
ADVERTISEMENT
0 votes
Related Articles
Related forms
 Worksheet With Answer Key")
 Worksheet With Answer Key")
 Worksheet With Answer Key")


 Worksheet With Answer Key")
Related Categories
Parent category: Education