Maps, Charts And Graphs Worksheet
ADVERTISEMENT
 1
1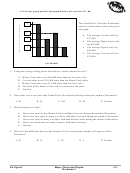 2
2 3
3Maps, Charts, & Graphs
Worksheet 1
Choice E , in multiple-choice questions, is always: I request help from the teacher .
You may mark E in addition to one other choice if you think that you have the right answer to the
question but you do not feel that you have a complete understanding of the problem.
Your teacher will decide whether to use the two-point or four-point scoring rubric for problems that use
numbers, pictures, or words to justify/explain your answer(s). You may request help for these questions,
too. Write the word “teacher” by your answer(s).
1. The circle graph below represents the number of students at Western High School in Enigma, Ohio.
Western replaced Etna High when it was abandoned. The total school population of Western High
School is 1,000. Which statement is true?
A. There are more than 250 9th graders.
B. There are more than 510 10th graders.
C. There are more than 250 10th graders.
D. There are less than 200 11th graders.
E. Teacher
12th
9th
11th
10th
2. Using the graph in Exercise 1, again, which statement is true?
A. Number of 9th graders > number of 10th graders.
B. Number of 9th graders + number on 10th graders < number of 11th graders.
C. Number of 12th graders > number of 10th graders.
D. Number of 10th graders > number of 9th graders.
E. Teacher
Go Figure?
Maps, Charts and Graphs
- 56 -
Worksheet 1
ADVERTISEMENT
0 votes
Related Articles
Related forms


Related Categories
Parent category: Education