Saturday X-Tra Representing And Reading Data Sheet - Mindset Learn
ADVERTISEMENT
 1
1 2
2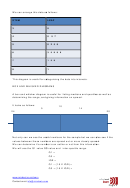 3
3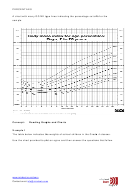 4
4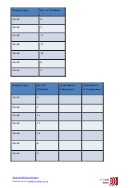 5
5 6
6 7
7 8
8 9
9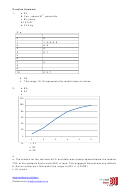 10
10Saturday X-tra
X-Sheet: 17
Data Handling
Part 3: Representing and Reading Data
Key Concepts
In this session, we will focus on summarising what you need to know about:
• Further Representation of Data
• Reading Graphs and Charts
Concept:
Further Representation of Data
We need a set of data e.g. A survey was done asking families how many children
they have in their family. The results were as follows:
35 families had 0 children
56 families had 1 child
79 families had 2 children
51 families had 3 children
20 families had 4 children
11 families had 5 children
1 family had 6 children
There are several ways of representing this data.
BAR CHART
HISTOGRAM
PIE CHART
Some new ways of representing the data:
FREQUENCY TABLE/ CUMULATIVE FREQUENCY
Cumulative Frequency: The word ‘cumulative’ means to add together.
The word ‘frequency’ tells us how often a data sample appears.
A cumulative frequency table is another method of organising data.
Contact us at:
info@mindset.co.za
Page 1
ADVERTISEMENT
0 votes
Related Articles
Related forms


Related Categories
Parent category: Education