Disparities In Stem Employment By Sex, Race, And Hispanic Origin - American Community Survey Reports (U.s. Census Bureau) Page 10
ADVERTISEMENT
 Printable pdf") 1
1 2
2 3
3 4
4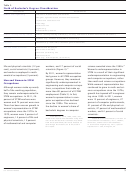 5
5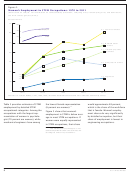 6
6 7
7 8
8 9
9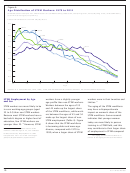 10
10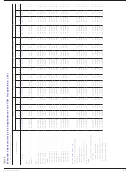 11
11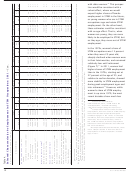 12
12 13
13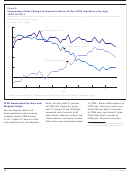 14
14 15
15 16
16 17
17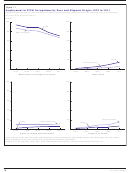 18
18 19
19 20
20 21
21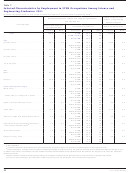 22
22 23
23 24
24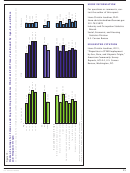 25
25Figure 6.
Age Distribution of STEM Workers: 1970 to 2011
(Data based on sample. For information on con dentiality protection, sampling error, nonsampling error, and de nitions,
see www.census.gov/acs/www/)
Percent distribution of STEM employment
5.0
1970
4.5
1980
4.0
1990
2000
3.5
3.0
2011
2.5
2.0
1.5
1.0
0.5
0.0
25
30
35
40
45
50
55
60
Age
Sources: U.S. Census Bureau, 1970, 1980, 1990, and 2000 decennial censuses and 2011 American Community Survey.
STEM Employment by Age
workers have a slightly younger
workers were in their twenties and
and Sex
age profile than non-STEM workers.
thirties.
19
Workers between the ages of 35
STEM workers are more likely to be
The aging of the STEM workforce
and 44 make up the largest share
in core working-age groups (aged
may have a disproportionate
of the STEM workforce, while work-
25 to 54) than non-STEM workers.
impact on women’s share of the
ers between the ages of 45 and 54
Because most STEM workers have a
STEM workforce. Some research
make up the largest share of non-
bachelor’s degree or higher level of
indicates that younger women
STEM employment (Table 4). Figure
education, few STEM workers are
today are more likely to pursue
6 shows that the STEM workforce
younger than 25.
However, STEM
18
training in a STEM field, and this
is becoming older and more age-
may contribute to their larger share
For more information about STEM
18
diverse, compared with 1970 to
of employment in STEM compared
workers under the age of 25, see “Selected
1990, when a larger share of STEM
Characteristics by Employment in STEM
Occupations: 2011” at <www.census.gov
The aging of the STEM workforce is
19
/people/io/publications/reports.html>.
similar to the aging of the total workforce.
10
U.S. Census Bureau
ADVERTISEMENT
0 votes
Related Articles
Related forms

 Survey Methodology #2012-02 - New Relationship And Marital Questions: A Reflection Of Changes To The Social And Legal Recognition Of Same-sex Couples In The U.s. - U.s. Census Bureau
Legal
Survey Methodology #2012-02 - New Relationship And Marital Questions: A Reflection Of Changes To The Social And Legal Recognition Of Same-sex Couples In The U.s. - U.s. Census Bureau
Legal
 Survey Methodology #2006-02 - Use Of Dependent Interviewing Procedures To Improve Data Quality In The Measurement Of Change - U.s. Census Bureau
Legal
Survey Methodology #2006-02 - Use Of Dependent Interviewing Procedures To Improve Data Quality In The Measurement Of Change - U.s. Census Bureau
Legal

 - Consolidated Bas - U.s. Census Bureau")


 En Espanol: Using Cognitive Interviews To Test The Functional Equivalency Of Questionnaire Translations - U.s. Bureau Of The Census")


Related Categories
Parent category: Legal