Disparities In Stem Employment By Sex, Race, And Hispanic Origin - American Community Survey Reports (U.s. Census Bureau) Page 13
ADVERTISEMENT
 Printable pdf") 1
1 2
2 3
3 4
4 5
5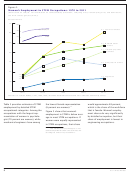 6
6 7
7 8
8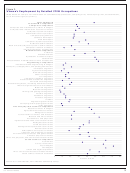 9
9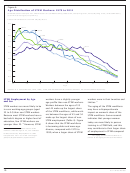 10
10 11
11 12
12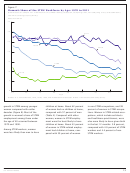 13
13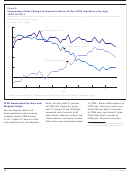 14
14 15
15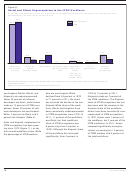 16
16 17
17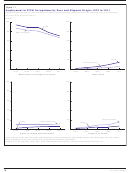 18
18 19
19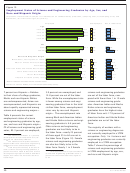 20
20 21
21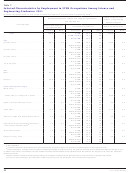 22
22 23
23 24
24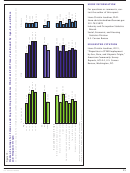 25
25Figure 7.
Women’s Share of the STEM Workforce by Age: 1970 to 2011
(Data based on sample. For information on con dentiality protection, sampling error, nonsampling error, and de nitions,
see www.census.gov/acs/www/)
Percent women
35
30
2011
25
1990
2000
20
15
1980
10
1970
5
0
25
30
35
40
45
50
55
60
Age
Sources: U.S. Census Bureau, 1970, 1980, 1990, and 2000 decennial censuses and 2011 American Community Survey.
growth in STEM among younger
children at home. About 62 percent
in non-STEM occupations, and 38
women compared with earlier
of women had no children at home,
percent of women in STEM occupa-
decades (Figure 8). Most of the
compared with 57 percent of men
tions. Women in STEM-related occu-
growth in women’s share of STEM
(Table 4). Compared with other
pations, which include architects
employment among those under
women, women in STEM employ-
and healthcare practitioners, were
the age of 40 occurred between
ment were the least likely to have
also more likely to have given birth
1970 and 1990.
children at home. About 43 percent
in the last 12 months: 5.8 percent,
of women in STEM-related employ-
compared with 4.9 percent of STEM
Among STEM workers, women
ment had children at home, com-
workers and 4.4 percent of non-
were less likely than men to have
pared with 39 percent of women
STEM workers.
13
U.S. Census Bureau
ADVERTISEMENT
0 votes
Related Articles
Related forms

 Survey Methodology #2012-02 - New Relationship And Marital Questions: A Reflection Of Changes To The Social And Legal Recognition Of Same-sex Couples In The U.s. - U.s. Census Bureau
Legal
Survey Methodology #2012-02 - New Relationship And Marital Questions: A Reflection Of Changes To The Social And Legal Recognition Of Same-sex Couples In The U.s. - U.s. Census Bureau
Legal
 Survey Methodology #2006-02 - Use Of Dependent Interviewing Procedures To Improve Data Quality In The Measurement Of Change - U.s. Census Bureau
Legal
Survey Methodology #2006-02 - Use Of Dependent Interviewing Procedures To Improve Data Quality In The Measurement Of Change - U.s. Census Bureau
Legal

 - Consolidated Bas - U.s. Census Bureau")


 En Espanol: Using Cognitive Interviews To Test The Functional Equivalency Of Questionnaire Translations - U.s. Bureau Of The Census")


Related Categories
Parent category: Legal