Disparities In Stem Employment By Sex, Race, And Hispanic Origin - American Community Survey Reports (U.s. Census Bureau) Page 15
ADVERTISEMENT
 Printable pdf") 1
1 2
2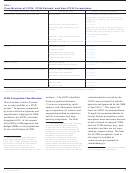 3
3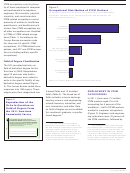 4
4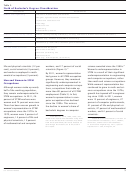 5
5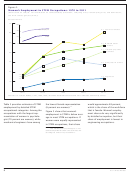 6
6 7
7 8
8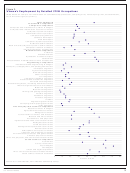 9
9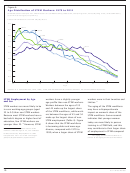 10
10 11
11 12
12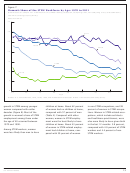 13
13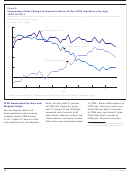 14
14 15
15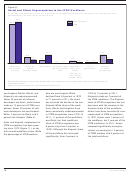 16
16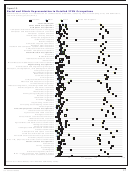 17
17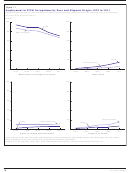 18
18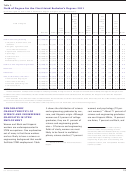 19
19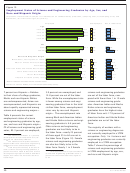 20
20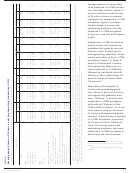 21
21 22
22 23
23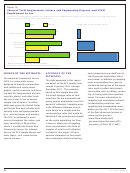 24
24 25
25Understanding Race and Hispanic Origin Concepts
The U.S. Census Bureau collects race and Hispanic origin information following the guidance of the U.S. Office
of Management and Budget’s (OMB) 1997 Revisions to the Standards for the Classification of Federal Data on
Race and Ethnicity.
These federal standards mandate that race and Hispanic origin (ethnicity) are separate and
1
distinct concepts and that when collecting these data via self-identification, two different questions must be
used. Starting in 1997, OMB required federal agencies to use a minimum of five race categories: White, Black or
African American, American Indian or Alaska Native, Asian, and Native Hawaiian or Other Pacific Islander. For
respondents unable to identify with any of these five race categories, OMB approved the inclusion of a sixth
category—Some Other Race. Individuals who chose more than one of the six race categories are referred to as
the Two or More Races population.
Individuals who responded to the question on race by indicating only one race are referred to as the race-
alone population or the group who reported only one race category. The text and figures of this report show
estimates for the race-alone population. This report uses five of the OMB-approved categories: White alone,
Black or African American alone, American Indian and Alaska Native alone, Asian alone, and Two or More
Races. In this report, a sixth category is comprised of those who report Some Other Race or Native Hawaiian or
Other Pacific Islander. Because of a small number of sample observations for Native Hawaiian or Other Pacific
Islanders employed in a STEM occupation (fewer than 6,000 individuals nationwide), this group is included with
Some Other Race.
People who identify their origin as Hispanic or Latino may be any race. For each race group, data in this report
include people who reported they were of Hispanic or Latino origin and people who reported they were not
Hispanic or Latino. Because Hispanics may be of any race, data in this report for Hispanics overlap with data
for race groups. In the analyses presented here, the term “non-Hispanic White” refers to people who are not
Hispanic and who reported White and no other race. The Census Bureau uses non-Hispanic Whites as the com-
parison group for other race groups and Hispanics. For more information on the concepts of race and Hispanic
origin, see K. Humes, N. Jones, and R. Ramirez, “Overview of Race and Hispanic Origin: 2010,” U.S. Census
Bureau, 2010 Census Briefs, 2011, available at <www.census.gov/prod/cen2010/briefs/c2010br-02.pdf>.
The 1997 Revisions to the Standards for the Classification of Federal Data on Race and Ethnicity, issued by OMB, is available at
1
<www.whitehouse.gov/omb/fedreg/1997standards.html>.
underrepresented in STEM occu-
Racial and ethnic representation
in any given STEM occupation.
25
pations. Although they made up
differs by detailed STEM occupa-
Using software developer, the larg-
about 15 percent of the workforce,
tion. Although the average racial
est STEM occupation, as an exam-
they held 7 percent of STEM jobs.
and ethnic distribution of the STEM
ple, Figure 10 shows that Asian
24
workforce is 71 percent non-
workers are overrepresented, while
Hispanic White, 15 percent Asian,
6 percent Black, and 7 percent
24
The estimates for Black and Hispanic
25
The estimates for Black and Hispanic
employment in STEM occupations are not
employment in STEM occupations are not
Hispanic, the distribution varies
statistically different.
statistically different.
15
U.S. Census Bureau
ADVERTISEMENT
0 votes
Related Articles
Related forms

 Survey Methodology #2012-02 - New Relationship And Marital Questions: A Reflection Of Changes To The Social And Legal Recognition Of Same-sex Couples In The U.s. - U.s. Census Bureau
Legal
Survey Methodology #2012-02 - New Relationship And Marital Questions: A Reflection Of Changes To The Social And Legal Recognition Of Same-sex Couples In The U.s. - U.s. Census Bureau
Legal
 Survey Methodology #2006-02 - Use Of Dependent Interviewing Procedures To Improve Data Quality In The Measurement Of Change - U.s. Census Bureau
Legal
Survey Methodology #2006-02 - Use Of Dependent Interviewing Procedures To Improve Data Quality In The Measurement Of Change - U.s. Census Bureau
Legal

 - Consolidated Bas - U.s. Census Bureau")


 En Espanol: Using Cognitive Interviews To Test The Functional Equivalency Of Questionnaire Translations - U.s. Bureau Of The Census")


Related Categories
Parent category: Legal