Disparities In Stem Employment By Sex, Race, And Hispanic Origin - American Community Survey Reports (U.s. Census Bureau) Page 17
ADVERTISEMENT
 Printable pdf") 1
1 2
2 3
3 4
4 5
5 6
6 7
7 8
8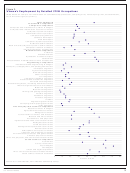 9
9 10
10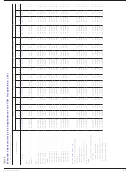 11
11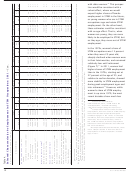 12
12 13
13 14
14 15
15 16
16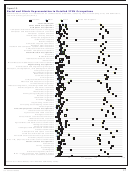 17
17 18
18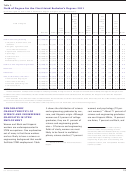 19
19 20
20 21
21 22
22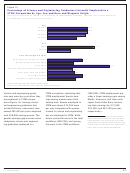 23
23 24
24 25
25Figure 10.
Racial and Ethnic Representation in Detailed STEM Occupations
(Data based on sample. For information on con dentiality protection, sampling error, nonsampling error, and de nitions,
see www.census.gov/acs/www/)
Hispanic
Black
Asian
White non-Hispanic
Total employed
Total STEM occupations
Computer occupations
Computer and information systems managers
Computer and information research scientists
Computer systems analysts
Information security analysts
Computer programmers
Software developers
Web developers
Computer support specialists
Database administrators
Network and computer systems administrators
Computer network architects
All other computer occupations
Mathematical occupations
Actuaries
Mathematicians
Operations research analysts
Statisticians
Miscellaneous mathematical science occupations
Engineering occupations
Architectural and engineering managers
Surveyors, cartographers, and photogrammetrists
Aerospace engineers
Agricultural engineers
Biomedical engineers
Chemical engineers
Civil engineers
Computer hardware engineers
Electrical and electronics engineers
Environmental engineers
Industrial engineers, including health and safety
Marine engineers and naval architects
Materials engineers
Mechanical engineers
Mining and geological engineers
Nuclear engineers
Petroleum engineers
All other engineers
Drafters
Engineering technicians
Surveying and mapping technicians
Sales engineers
Life and physical science occupations
Natural sciences managers
Agricultural and food scientists
Biological scientists
Conservation scientists and foresters
Medical and life scientists
Astronomers and physicists
Agricultural and food science technicians
Biological technicians
Chemical technicians
Geological and petroleum technicians
Nuclear technicians
Atmospheric and space scientists
Chemists and materials scientists
Environmental scientists and geoscientists
All other physical scientists
Misc. life, physical, and social science technicians
Social science occupations
Economists
Survey researchers
Psychologists
Sociologists
Urban and regional planners
Misc. social scientists and related workers
Social science research assistants
0
20
40
60
80
100
Percent
Source: U.S. Census Bureau, 2011 American Community Survey.
17
U.S. Census Bureau
ADVERTISEMENT
0 votes
Related Articles
Related forms

 Survey Methodology #2012-02 - New Relationship And Marital Questions: A Reflection Of Changes To The Social And Legal Recognition Of Same-sex Couples In The U.s. - U.s. Census Bureau
Legal
Survey Methodology #2012-02 - New Relationship And Marital Questions: A Reflection Of Changes To The Social And Legal Recognition Of Same-sex Couples In The U.s. - U.s. Census Bureau
Legal
 Survey Methodology #2006-02 - Use Of Dependent Interviewing Procedures To Improve Data Quality In The Measurement Of Change - U.s. Census Bureau
Legal
Survey Methodology #2006-02 - Use Of Dependent Interviewing Procedures To Improve Data Quality In The Measurement Of Change - U.s. Census Bureau
Legal

 - Consolidated Bas - U.s. Census Bureau")


 En Espanol: Using Cognitive Interviews To Test The Functional Equivalency Of Questionnaire Translations - U.s. Bureau Of The Census")


Related Categories
Parent category: Legal