Disparities In Stem Employment By Sex, Race, And Hispanic Origin - American Community Survey Reports (U.s. Census Bureau) Page 18
ADVERTISEMENT
 Printable pdf") 1
1 2
2 3
3 4
4 5
5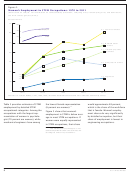 6
6 7
7 8
8 9
9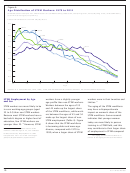 10
10 11
11 12
12 13
13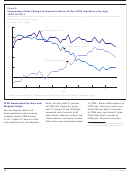 14
14 15
15 16
16 17
17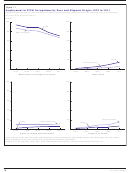 18
18 19
19 20
20 21
21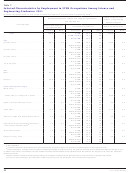 22
22 23
23 24
24 25
25Figure 11.
Employment in STEM Occupations by Race and Hispanic Origin: 1970 to 2011
(Data based on sample. For information on con dentiality protection, sampling error, nonsampling error, and de nitions,
see www.census.gov/acs/www/)
Percent
100
100
STEM
80
80
Total employed
60
60
40
40
20
20
STEM
Total employed
0
0
1970
1980
1990
2000
2011
1970
1980
1990
2000
2011
White alone, not Hispanic or Latino
Asian alone
100
100
80
80
60
60
40
40
20
Total employed
20
STEM
Total employed
STEM
0
0
1970
1980
1990
2000
2011
1970
1980
1990
2000
2011
Black or African American alone
Hispanic or Latino
Note: Estimates for the American Indian and Alaska Native, Native Hawaiian and Other Paci c Islander, Some Other Race, and Two or More
Races populations are not shown because of a small number of sample observations.
Sources: U.S. Census Bureau, 1970, 1980, 1990, and 2000 decennial censuses and 2011 American Community Survey.
18
U.S. Census Bureau
ADVERTISEMENT
0 votes
Related Articles
Related forms

 Survey Methodology #2012-02 - New Relationship And Marital Questions: A Reflection Of Changes To The Social And Legal Recognition Of Same-sex Couples In The U.s. - U.s. Census Bureau
Legal
Survey Methodology #2012-02 - New Relationship And Marital Questions: A Reflection Of Changes To The Social And Legal Recognition Of Same-sex Couples In The U.s. - U.s. Census Bureau
Legal
 Survey Methodology #2006-02 - Use Of Dependent Interviewing Procedures To Improve Data Quality In The Measurement Of Change - U.s. Census Bureau
Legal
Survey Methodology #2006-02 - Use Of Dependent Interviewing Procedures To Improve Data Quality In The Measurement Of Change - U.s. Census Bureau
Legal

 - Consolidated Bas - U.s. Census Bureau")


 En Espanol: Using Cognitive Interviews To Test The Functional Equivalency Of Questionnaire Translations - U.s. Bureau Of The Census")


Related Categories
Parent category: Legal