Disparities In Stem Employment By Sex, Race, And Hispanic Origin - American Community Survey Reports (U.s. Census Bureau) Page 20
ADVERTISEMENT
 Printable pdf") 1
1 2
2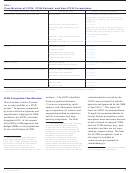 3
3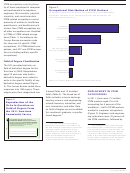 4
4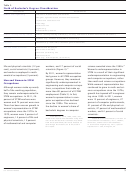 5
5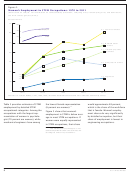 6
6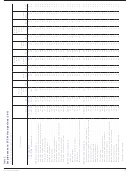 7
7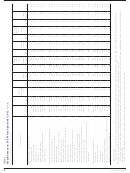 8
8 9
9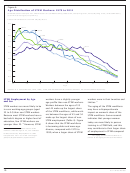 10
10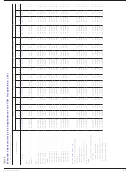 11
11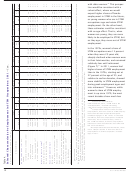 12
12 13
13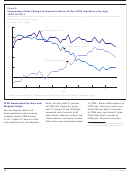 14
14 15
15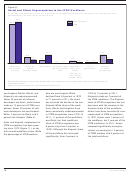 16
16 17
17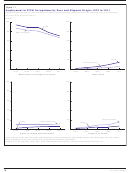 18
18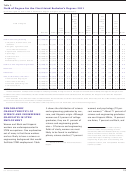 19
19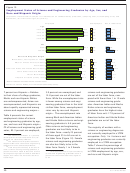 20
20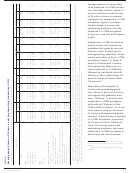 21
21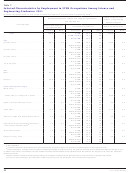 22
22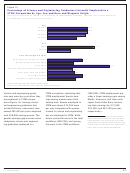 23
23 24
24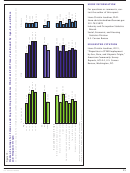 25
25Figure 12.
Employment Status of Science and Engineering Graduates by Age, Sex, and
Race and Hispanic Origin
(In percent.
Data based on sample. For information on con dentiality protection, sampling error, nonsampling error, and
de nitions, see www.census.gov/acs/www/)
Employed
Unemployed
Not in labor force
Age
25 to 34
84.8
4.2
11.0
35 to 44
86.9
3.3
9.8
45 to 54
86.6
3.8
9.6
55 to 64
73.1
4.2
22.7
Sex
Male
87.7
3.8
8.6
Female
77.2
4.0
18.7
Race and Hispanic Origin
White alone, not Hispanic or Latino
83.8
3.4
12.7
Black or African American alone
82.0
6.6
11.4
Asian alone
81.9
3.9
14.2
75.5
6.6
17.9
American Indian and Alaska Native alone
81.9
Some Other Race and NHOPI*
6.1
12.0
Two or More Races
81.0
5.8
13.2
Hispanic or Latino (of any race)
82.7
4.9
12.4
*Native Hawaiian and Other Paci c Islander alone.
Source: U.S. Census Bureau, 2011 American Community Survey.
7 percent are Hispanic.
Relative
3.9 percent are unemployed, and
science and engineering graduates
28
to their share of college graduates,
12.8 percent are out of the labor
are out of the labor force, com-
Blacks and non-Hispanic Whites
force. While the unemployment rate
pared with fewer than 1 in 10 male
are underrepresented, Asians are
is lower among science and engi-
science and engineering gradu-
overrepresented, and Hispanics are
neering graduates than in the total
ates. American Indian and Alaska
about equally represented among
civilian labor force, unemployment
Native science and engineering
science and engineering majors.
rates vary by race and Hispanic
graduates have the highest rates
29
origin.
The unemployment rate
of labor force exit: 17.9 percent of
31
Table 6 presents the current
among Black and American Indian
American Indian and Alaska Native
employment status of science
and Alaska Native science and engi-
graduates are out of the labor
and engineering graduates by age,
neering graduates is 6.6 percent.
force.
sex, and race and Hispanic origin.
30
Older science and engineering
Of all science and engineering grad-
The majority of workers with a
graduates are less likely to be in
uates, 83.3 percent are employed,
science or engineering degree are
the labor force—nearly 23 percent
not currently employed in a STEM
of those aged 55 to 64 are not in
28
The estimates for Blacks (7.1 percent)
occupation. Only 1 in 4 science and
and Hispanics (6.8 percent) round to 7 per-
the labor force (Figure 12). Female
cent but are statistically different.
engineering graduates are currently
science and engineering graduates
29
The estimates for Hispanic bachelor’s
employed in a STEM occupation.
degree holders and science and engineering
are also less likely to be in the
graduates are not statistically different.
Table 7 shows the percentage of
labor force. Nearly 1 in 5 female
30
From this point forward, to be consid-
science and engineering graduates
ered a science and engineering graduate, a
in STEM employment by age, sex,
person must have listed at least one science
31
Unemployment was 3.9 percent among
and engineering major for field of bachelor’s
science and engineering graduates and 6.9
and race and Hispanic origin.
degree, but it does not have to be the first
percent for the civilian labor force aged 25
listed major.
to 64.
20
U.S. Census Bureau
ADVERTISEMENT
0 votes
Related Articles
Related forms

 Survey Methodology #2012-02 - New Relationship And Marital Questions: A Reflection Of Changes To The Social And Legal Recognition Of Same-sex Couples In The U.s. - U.s. Census Bureau
Legal
Survey Methodology #2012-02 - New Relationship And Marital Questions: A Reflection Of Changes To The Social And Legal Recognition Of Same-sex Couples In The U.s. - U.s. Census Bureau
Legal
 Survey Methodology #2006-02 - Use Of Dependent Interviewing Procedures To Improve Data Quality In The Measurement Of Change - U.s. Census Bureau
Legal
Survey Methodology #2006-02 - Use Of Dependent Interviewing Procedures To Improve Data Quality In The Measurement Of Change - U.s. Census Bureau
Legal

 - Consolidated Bas - U.s. Census Bureau")


 En Espanol: Using Cognitive Interviews To Test The Functional Equivalency Of Questionnaire Translations - U.s. Bureau Of The Census")


Related Categories
Parent category: Legal