Disparities In Stem Employment By Sex, Race, And Hispanic Origin - American Community Survey Reports (U.s. Census Bureau) Page 22
ADVERTISEMENT
 Printable pdf") 1
1 2
2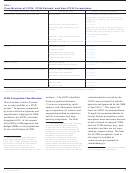 3
3 4
4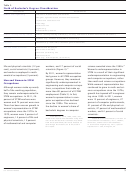 5
5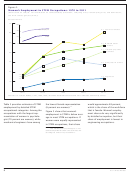 6
6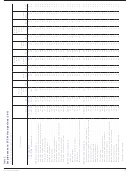 7
7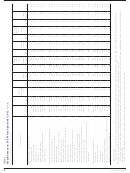 8
8 9
9 10
10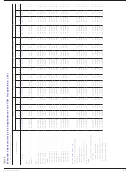 11
11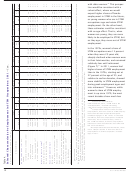 12
12 13
13 14
14 15
15 16
16 17
17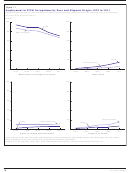 18
18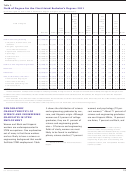 19
19 20
20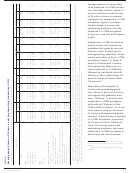 21
21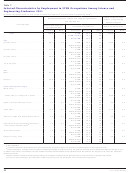 22
22 23
23 24
24 25
25Table 7.
Selected Characteristics by Employment in STEM Occupations Among Science and
Engineering Graduates: 2011
(Civilian employed aged 25 to 64 with a bachelor’s degree in a science and engineering field
)
1
STEM workforce with a
Relationship between science and engineering education
science or engineering
and employment
bachelor’s degree
Characteristics
Science and engineer-
Occupational distribution
STEM workforce share
ing degree holders
Percent
MOE
Occupation
Percent
MOE
Percent
MOE
2
2
1
Total . . . . . . . . . . . . . . . . . . . . . . . . . . .
100 .0
X
STEM
24 .9
0 .2
100 .0
X
STEM-related
10 .7
0 .2
Non-STEM
64 .3
0 .2
Age
25 to 34 years . . . . . . . . . . . . . . . . . . . . . . . . .
28.1
0.2
STEM
26.6
0.4
29.9
0.5
STEM-related
10.6
0.3
Non-STEM
62.9
0.5
35 to 44 years . . . . . . . . . . . . . . . . . . . . . . . . .
27.6
0.2
STEM
26.6
0.5
29.5
0.5
STEM-related
10.7
0.3
Non-STEM
62.6
0.5
45 to 54 years . . . . . . . . . . . . . . . . . . . . . . . . .
25.6
0.2
STEM
25.5
0.3
26.2
0.4
STEM-related
10.4
0.3
Non-STEM
64.1
0.4
55 to 64 years . . . . . . . . . . . . . . . . . . . . . . . . .
18.7
0.2
STEM
19.2
0.3
14.4
0.3
STEM-related
11.5
0.3
Non-STEM
69.3
0.4
Sex
Male . . . . . . . . . . . . . . . . . . . . . . . . . . . . . . . . .
61.2
0.2
STEM
31.1
0.3
76.3
0.3
STEM-related
8.8
0.2
Non-STEM
60.1
0.3
Female . . . . . . . . . . . . . . . . . . . . . . . . . . . . . . .
38.8
0.2
STEM
15.3
0.2
23.7
0.3
STEM-related
13.8
0.2
Non-STEM
71.0
0.3
Race and Hispanic Origin
White alone . . . . . . . . . . . . . . . . . . . . . . . . . . .
76.4
0.2
STEM
23.0
0.2
70.6
0.4
STEM-related
10.8
0.2
Non-STEM
66.2
0.3
White alone, not Hispanic or Latino . . . . . . .
71.5
0.2
STEM
23.3
0.2
66.9
0.4
STEM-related
10.9
0.2
Non-STEM
65.8
0.3
Black or African American alone . . . . . . . . . . .
7.0
0.1
STEM
17.4
0.8
4.9
0.2
STEM-related
9.8
0.6
Non-STEM
72.7
0.9
Asian alone . . . . . . . . . . . . . . . . . . . . . . . . . . .
13.0
0.1
STEM
41.4
0.6
21.5
0.4
STEM-related
11.4
0.4
Non-STEM
47.3
0.6
American Indian and Alaska Native alone . . . .
0.3
0.1
STEM
16.4
2.6
0.2
0.1
STEM-related
7.4
1.8
Non-STEM
76.2
3.3
Some Other Race and Native Hawaiian or
1.5
0.1
STEM
18.0
1.5
1.1
0.1
Other Pacific Islander alone
. . . . . . . . . . . . .
STEM-related
9.4
1.3
3
Non-STEM
72.6
1.8
Two or More Races . . . . . . . . . . . . . . . . . . . . .
1.8
0.1
STEM
23.5
1.6
1.7
0.1
STEM-related
10.8
0.9
Non-STEM
65.7
1.8
Hispanic (of any race) . . . . . . . . . . . . . . . . . . .
6.7
0.1
STEM
18.4
0.7
5.0
0.2
STEM-related
9.0
0.6
Non-STEM
72.6
0.8
X Not applicable.
Includes individuals with multiple majors who report having at least one major in a science or engineering field at the bachelor’s level.
1
Data are based on a sample and are subject to sampling variability. A margin of error is a measure of an estimate’s variability. The larger the margin of error
2
in relation to the size of the estimates, the less reliable the estimate. When added to and subtracted from the estimate, the margin of error forms the 90 percent
confidence interval.
Native Hawaiian and Other Pacific Islander alone was combined with Some Other Race because of a small number of sample observations.
3
Source: U.S. Census Bureau, 2011 American Community Survey. For more information, see <www.acs.census.gov/acs>.
22
U.S. Census Bureau
ADVERTISEMENT
0 votes
Related Articles
Related forms

 Survey Methodology #2012-02 - New Relationship And Marital Questions: A Reflection Of Changes To The Social And Legal Recognition Of Same-sex Couples In The U.s. - U.s. Census Bureau
Legal
Survey Methodology #2012-02 - New Relationship And Marital Questions: A Reflection Of Changes To The Social And Legal Recognition Of Same-sex Couples In The U.s. - U.s. Census Bureau
Legal
 Survey Methodology #2006-02 - Use Of Dependent Interviewing Procedures To Improve Data Quality In The Measurement Of Change - U.s. Census Bureau
Legal
Survey Methodology #2006-02 - Use Of Dependent Interviewing Procedures To Improve Data Quality In The Measurement Of Change - U.s. Census Bureau
Legal

 - Consolidated Bas - U.s. Census Bureau")


 En Espanol: Using Cognitive Interviews To Test The Functional Equivalency Of Questionnaire Translations - U.s. Bureau Of The Census")


Related Categories
Parent category: Legal