Scatter Plots And Trend Lines
ADVERTISEMENT
 1
1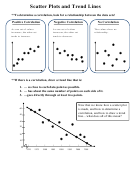 2
2 3
3 4
4Scatter Plots and Trend Lines
Objectives:
…to construct scatter plots
...to determine correlations in scatter plots
...to draw a trend line
...to make conclusions based on trend lines
Assessment Anchor:
8.E.4.1 – Draw conclusions, make inferences and/or evaluate hypotheses
based on statistical and data displays.
Vocabulary alert!!
Vocabulary alert!!
Vocabulary alert!!
Vocabulary alert!!
SCATTER PLOT – a graph that shows a relationship
between two sets of data
CORRELATION – a relationship between two sets of data
TREND LINE – a line that closely fits the data in a scatter
plot
NOTES and EXAMPLES
**To make a scatter plot, graph the data as ordered pairs!
Words Minutes
12
Typing Speed
14
5
10
10
3
8
25
8
6
30
10
4
12
5
2
2
2
0
25
6
0
5
10
15
20
25
30
35
Words
ADVERTISEMENT
0 votes
Related Articles
Related forms


Related Categories
Parent category: Business