Scatter Plots Worksheet
ADVERTISEMENT
 1
1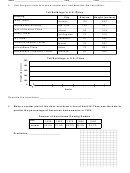 2
2Name
________________________________________
Date
___________________
Class
__________________
9.9 Scatter Plots Worksheet
1. Use the given data to make a scatter plot.
Calories and Fat Per Portion of Meat & Fish
Fat (grams)
Calories
Fish sticks (breaded)
3
50
Shrimp (fried)
9
190
Tuna (canned in oil)
7
170
Ground beef (broiled)
10
185
Roast beef (relatively lean)
7
165
Ham (light cure, lean and fat)
19
245
Do the following data sets have a positive, a negative, or no correlation?
2.
The size of the bag of popcorn and the price of the popcorn: __________________
3.
The increase in temperature and number of snowboards sold: _________________
4.
Use the data to predict how much money Tyler would be paid for babysitting
hrs.
Amount Tyler Earns Babysitting
Amount Tyler Earns Babysitting
Amount Tyler Earns Babysitting
Amount Tyler Earns Babysitting
Amount Tyler Earns Babysitting
Amount Tyler Earns Babysitting
Amount Tyler Earns Babysitting
Amount Tyler Earns Babysitting
Amount Tyler Earns Babysitting
Hours
1
2
3
4
5
6
7
8
Amount
$4
$8
$12
$16
$20
$24
$28
$32
According to the data, Tyler would get paid $
for babysitting
hours.
_______
ADVERTISEMENT
0 votes
Related Articles
Related forms


Related Categories
Parent category: Business