The Density And Volume Of A Water-Alcohol Mixture - Wikieducator Page 3
ADVERTISEMENT
 1
1 2
2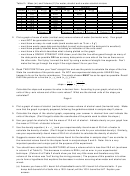 3
3 4
4Table 2: Mass (m) and Volume (V) for water, alcohol and a water–alcohol mixture
Water
Alcohol
MIxture
mass water
sum
+
–
TRIAL
V ( mL)
m (g)
V ( mL)
m (g)
V ( mL)
m (g)
mass alcohol
mixture
1
0.0
––––
25.0
25.0
2
5.0
20.0
3
10.0
15.0
4
15.0
10.0
5
20.0
5.0
6
25.0
0.0
––––
25.0
Column 1
Column 2
Column 3
Column 4
Column 5
Column 6
2. Plot a graph of mass of water (vertical axis) versus volume of water (horizontal axis). Your graph
• must NOT be generated on a computer
• must have an easy–to–read scale (avoid scales such as “3 cm = 5 g”)
• must have easily–seen data points plotted (a small circle around the data point is excellent)
• must have properly labelled axes, including an indication of the units used
• must have a title which describes what is being plotted on the graph
• must have a SINGLE STRAIGHT LINE drawn, such that the line either goes through as many of
the data points as possible OR has as many data points on one side of the line as there are on
the other side. Don’t play “connect the dots” by using a series of straight–line segments. Don’t
make the line go through the origin if the origin doesn’t lie on your line.
3. Read TWO POINTS from your “best” straight line and use the points to calculate the slope of the line.
State the coordinates of the points used. Do NOT use experimental data points UNLESS they
happen to lie on the line by coincidence. The points chosen MUST be as far apart as possible. Recall
that if the points on a line are (x
, y
) and (x
, y
), then
1
1
2
2
y
– y
R I S E
2
1
slope =
=
.
x
– x
R U N
2
1
Calculate the slope and express its value in decimal form. According to your graph, what are the
units of the y–axis values and of the x-axis values? What are the derived units of the slope you
calculated?
Page 4
4. Plot a graph of mass of alcohol (vertical axis) versus volume of alcohol used (horizontal axis). Make
sure that the graph is properly prepared, following the guidelines stated in analysis step 2, above.
5. Calculate the slope of the alcohol graph, expressing your answer in decimal form and indicate the
units of the slope. (Don't forget to state the coordinates of the points used to obtain the slope.)
6. Use your graph for alcohol to find the mass of 12.5 mL of alcohol. Indicate clearly on your graph how
the mass of 12.5 mL of alcohol is found.
7. Use the density equation ( d =
m
/
) and your experimentally–found mass of 25.0 mL of water to
V
calculate the density of water. (Don't forget to include the units for your calculated density.) Similarly,
use your experimentally–found mass of 25.0 mL of alcohol to calculate the density of alcohol.
8. Suggest a reason why the numerical values found for the densities in analysis step 7 are so similar to
the numerical values found for the slopes found in analysis steps 3 and 5. Note: this is a very
important question and a major part of the purpose of this experiment.
9. You should have noticed that the MIXTURES all have a volume which is less than 25.0 mL (as shown
in column 3 of Table 2). This decrease in volume is REAL, not an error in your experimental
technique. (Column 6 of Table 2 should show you that very little mass and therefore very little
volume of the mixture was “lost” during the mixing process.) The purpose of this question is to allow
you to form a hypothesis that explains the decrease in volume occurring when water and alcohol are
mixed.
(a) Assume you have a 50 L barrel full of basketballs and a 50 L barrel full of tennis balls. If you
dump both barrels full of balls into a 100 L barrel, will the 100 L barrel be full? Explain your
answer.
ADVERTISEMENT
0 votes
Related Articles
Related forms


Related Categories
Parent category: Medical