Body Types Chart Page 4
ADVERTISEMENT
 1
1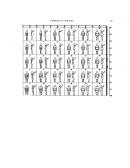 2
2 3
3 4
4The BIG
The bodybuilder image grid was designed to measure the perceptual body image disturbance in
males and perceived attractiveness of the male body to both men and women. The figures used
in the BIG vary along dimensions of muscularity and body fat. Directions for males instruct
individuals to make four choices: (a) the figure they think best represents their current body
type, (b) the figure they think best represents their ideal body type, (c) the body type that is most
attractive, and (d) the body type that is most attractive to the opposite sex. The scale is intended
to be used for males with any sexual preference; by asking for ratings of most attractive and
most attractive to the opposite sex, individuals make ratings of attractiveness independent of
their sexual preference. The BIG-O grid has two scales analogous to the measurement of
longitude (body fat columns) and latitude (muscle mass rows). The top left figure represents the
column with the least body fat, and row with the least muscle mass. From left to right the
columns increase in body fat from 1: “extremely low body fat” to 6: “extremely high body fat”.
From top to bottom the figures increase in muscle mass from 1: “extremely low muscle mass to
5: “extremely high muscle mass”. To measure perceptual disturbance, a discrepancy index is
calculated for body fat (current fat−ideal fat=desired fat) and muscle mass (ideal muscle−current
muscle=desired muscle) by subtracting the corresponding column and row scores.
ADVERTISEMENT
0 votes
Related Articles
Related forms


Related Categories
Parent category: Medical