Reading A Solubility Chart
ADVERTISEMENT
 1
1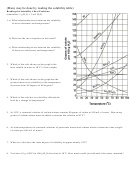 2
2 3
3 4
4NAME____________________________________________PERIOD______ DATE______________________
CHEMISTRY Solutions – Solubility Curves Intro
Reading a Solubility Chart
1) The curve shows the # of grams of solute
in a saturated solution containing 100 mL
or 100 g of water at a certain temperature.
(remember: 1 mL H
O = 1 g H
O)
2
2
2) Any amount of solute below the line
indicates an unsaturated solution at a
certain temperature
3) Any amount of solute above the line in
which all of the solute has dissolved
indicates a supersaturated solution.
4) If the amount of solute is above the line but
has not all dissolved, the solution is
saturated and the # grams of solute settled
on the bottom of the container = total # g in
solution – # g of a saturated solution at that
temperature. (according to the curve)
5) Solutes whose curves move upward w/
increased temperature are typically solids
b/c the solubility of solids increases w/
increased temperature.
6) Solutes whose curves move downward w/
increased temperature are typically gases
b/c the solubility of gases decreases with
increased temperature.
Solubility Problems example
(Many may be done by reading the solubility table)
o
1. At 10
C, 80 g of NaNO
will dissolve in
3
100 mL (a saturated solution)
2. To find the # grams needed to saturate a solution when the volume is NOT 100 mL use the following
strategy to find answer: (e. g., 60 mL of H
O will be saturated with how many grams of NaNO
?)
2
3
Start w/ known vol. x Solubility/100mL at set temp. = amount of Solute needed to saturate
Ex. 60 mL H
O x 80 g NaNO
= 48 g NaNO
needed to saturate solution
2
3
3
100 mL H
O
2
or if the chart is in units of 100 g of H
O use the density of water conversion 1mL H
O= 1 g H
O
2
2
2
Ex.
60 mL H
O x
1 g H
O x 80 g NaNO
= 48 g NaNO
2
2
3
3
1 mL H
O
100 g H
O
2
2
ADVERTISEMENT
0 votes
Related Articles
Related forms


Related Categories
Parent category: Education