Interpreting A Tally Chart Worksheet
ADVERTISEMENT
 1
1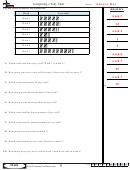 2
2Name:
Interpreting a Tally Chart
Use the chart to answer each question.
A n s w e r s
Week
Toys Sold
week 5
1.
Week 1
25
12
Week 2
26
2.
Week 3
24
week 2
3.
Week 4
13
1
4.
Week 5
23
Week 6
11
2
5.
Week 7
43
week 6
6.
week 7
7.
1) Which week had fewer toys sold? Week 1 or week 5?
25
8.
2) How many fewer toys were sold on week 4 than were sold on week 1?
week 7
9.
3) Which week had exactly 26 toys sold?
30
10.
4) How many weeks had fewer than 12 toys sold?
5) How many weeks had more than 25 toys sold?
6) Which week had the fewest number of toys sold?
7) Which week had the greatest number of toys sold?
8) How many toys were sold on week 1?
9) Which week had more toys sold? Week 6 or week 7?
10) How many more toys were sold on week 7 than were sold on week 4?
1-10 90 80 70 60 50 40 30 20 10 0
Math
9
ADVERTISEMENT
0 votes
Related Articles
Related forms


Related Categories
Parent category: Education