Interpreting A Tally Chart Worksheet
ADVERTISEMENT
 1
1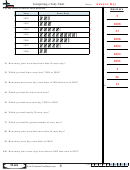 2
2Name:
Interpreting a Tally Chart
Use the chart to answer each question.
A n s w e r s
Year
Snow Days
5
1.
2002
13
2008
2003
15
2.
2004
26
33
3.
2005
46
2008
4.
2006
37
2007
27
2004
5.
2008
10
2004
6.
2005
7.
1) How many years were there fewer than 36 snow days?
2
8.
2) Which year had fewer snow days? 2004 or 2008?
26
9.
3) How many more snow days were there in 2005 than were in 2002?
14
10.
4) Which year had the fewest snow days?
5) Which year had more snow day? 2002 or 2004?
6) Which year had exactly 26 snow days?
7) Which year had the greatest number of snow days?
8) How many years were there more than 35 snow days?
9) How many snow days were there in 2004?
10) How many fewer snow days were there in 2002 than were in 2007?
1-10 90 80 70 60 50 40 30 20 10 0
Math
6
ADVERTISEMENT
0 votes
Related Articles
Related forms


Related Categories
Parent category: Education