Interpreting A Tally Chart Worksheet
ADVERTISEMENT
 1
1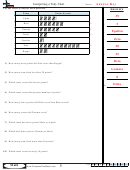 2
2Name:
Interpreting a Tally Chart
Use the chart to answer each question.
A n s w e r s
Team
Points Scored
39
1.
Alpha
21
5
Beta
30
2.
Gamma
25
Epsilon
3.
Delta
10
Zeta
4.
Epsilon
6
Zeta
50
20
5.
Kappa
11
25
6.
Beta
7.
1) How many more points did Zeta score than Kappa?
Gamma
8.
2) How many teams had less than 29 points?
0
9.
3) Which team scored the fewest points?
Delta
10.
4) Which team scored the greatest number of points?
5) How many fewer points did Delta score than Beta scored?
6) How many points did Gamma score?
7) Which team had more points? Beta or Alpha?
8) Which had fewer points? Gamma or Beta?
9) How many teams had more than 50 points?
10) Which team scored exactly 10 points?
1-10 90 80 70 60 50 40 30 20 10 0
Math
5
ADVERTISEMENT
0 votes
Related Articles
Related forms


Related Categories
Parent category: Education