Interpreting A Tally Chart Worksheet
ADVERTISEMENT
 1
1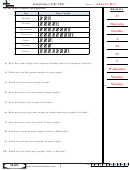 2
2Name:
Interpreting a Tally Chart
Use the chart to answer each question.
A n s w e r s
Day
Bugs Caught
27
1.
Monday
14
Thursday
Tuesday
24
2.
Wednesday
39
Tuesday
3.
Thursday
42
3
4.
Friday
16
Saturday
15
24
5.
Sunday
37
23
6.
0
7.
1) How many fewer bugs were caught on Saturday than were caught on Thursday?
Wednesday
8.
2) Which day had the greatest number of bugs caught?
Monday
9.
3) Which day had exactly 24 bugs caught?
Monday
10.
4) How many days were more than 27 bugs caught?
5) How many bugs were caught on Tuesday?
6) How many more bugs were caught on Sunday than were caught on Monday?
7) How many days were fewer than 12 bugs caught?
8) Which day had more bugs caught? Friday or Wednesday?
9) Which day had the fewest number of bugs caught?
10) Which day had fewer bugs caught? Friday or Monday?
1-10 90 80 70 60 50 40 30 20 10 0
Math
1
ADVERTISEMENT
0 votes
Related Articles
Related forms


Related Categories
Parent category: Education