Box And Whisker Plots And Measures Of Central Tendency Worksheet
ADVERTISEMENT
 1
1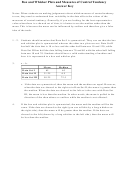 2
2Box and Whisker Plots and Measures of Central Tendency
The box and whisker plots for three data sets are shown below.
Data Set I
Data Set II
Data Set III
1. Compare the shapes of the box and whisker plots.
2. What do these shapes tell you about the variation in the data sets.
3. The data sets for these box and whisker plots are given below.
Data Set I:
10
20
30
40
50
60
70
80
90
100
110
120
Data Set II:
1
2
3
4
5
6
7
8
9
100
110
120
Data Set III:
10
10
11
70
71
72
73
74
75
76
78
79
a. Calculate the mean of each data set.
b. Locate the mean of each data set on its box and whisker plot by drawing a vertical
line that passes through the mean.
c. How do the mean and median of each data set compare?
4. What does the shape of a box and whisker plot tell you about the relationship between
the mean and the median of its data set?
ADVERTISEMENT
0 votes
Related Articles
Related forms


Related Categories
Parent category: Education