Uk Boys 2-20 Yr Childhood And Puberty Close Monitoring (Cpcm) Growth Chart
ADVERTISEMENT
 Growth Chart Printable pdf") 1
1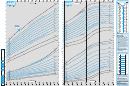 2
250
50
BOYS UK
Clinical assessment of
7
8
9
10
11
12
13
14
15
16
17
18
19
20
Body mass index
pubertal progress
2-20yr
Please place sticker (if available) otherwise write in space provided.
49
49
(BMI) chart
Tanner stage assessment requires
Age in years
considerable expertise; so unless
Childhood and puberty
Name:
________________________________________
48
48
BOYS
you have been adequately trained
you should use the “puberty phases”
4
close monitoring CPCM)
47
47
NHS / CHI No:
approach (see chart instructions
2-20 years
over). For a detailed description of
growth chart
46
46
each stage consult a standard
Hospital No:
3
4
5
6
paediatric reference book (see
for
45
45
Date of Birth:
further information).
44
44
Assessment by clinical examination
Adult height predictor
should be undertaken only with
43
43
This allows prediction of the child’s adult height based on
parental and child consent and
with adequate privacy.
their current height, including a regression adjustment to
This chart is mainly intended for use in children and young
allow for the tendency of very tall and short children to be
42
42
The charts below show the age
people whose growth requires close monitoring, or whose
less extreme in height as adults. Four boys out of five will
ranges for each of the five Tanner
measurements are outside the usual centile range. It is based
have an adult height within ±6 cm of this predicted height.
41
41
stages of genital and pubic hair
on the UK 1990 growth reference from 4-20 years and at
development, and mean testicular
birth, and the WHO growth standard from 2-4 years (as per
Body mass index BMI) centile chart
40
40
volumes
using
the
Prader
the UK-WHO 0-4 years charts). For children aged under 2
orchidometer.
Where over- or underweight is a concern BMI can be
years whose growth needs detailed assessment, the neonatal
calculated and plotted on the BMI chart. BMI is calculated by
39
39
Once the Tanner stage has been
and infant close monitoring chart (NICM) is available. This 2-
dividing weight (in kg) by the square of height (in metres e.g.
determined, make a small dot on
20 chart has a number of novel features including some
1.32 m, not centimetres e.g. 132 cm). A simple way to do this
38
38
the relevant stage line at the child's
puberty phase specific centile lines. For further information
on a calculator or mobile phone is:
age. The horizontal dotted lines
1. Enter the weight; 2. Divide by height;
show the stage centiles for age. If
about the development of this chart and supporting
37
37
3. Divide the result by height.
the point is between the 2nd and
references see .
98th centiles then development is
36
36
within normal limits. If the point is
Birth centile plotting scale
The result should be plotted on the BMI chart provided. To
above the 98th centile development
allow the monitoring of severely obese children, the BMI
35
35
The chart starts at age 2 years, but there is a scale to the left
is precocious, and if below the 2nd
chart displays high lines at +3, +3.33, +3.66 and +4 SD, and
of the chart where birth weight, length and head
centile it is delayed. In these cases
-4 and -5 SD for those severely underweight.
34
34
circumference for term infants can be plotted.
further
investigation
may
be
required. Please note that unlike
Pubertal assessment
Children with extremes of height or weight
33
33
height and weight centiles, the
For most purposes the puberty phase approach will be
stage centile position may change
In addition to the usual nine centile lines, the height charts
sufficient, based on the history and clinical examination as
substantially from one age to the
32
32
also show lines -4 and -5 SD below and +4 SD above the
below. Where more detailed assessment of the progress of
next.
mean. The additional weight lines are -4, -5, and +3 SD
puberty is required see the chart flap for Tanner staging.
31
31
Genital stage
respectively. Children whose growth lies on these outer lines
The three vertical black lines (puberty lines) on the right hand
are likely to have additional clinical problems, and if not
99.6th
side of the chart (9-20 years) indicate the normal age limits
Precocious
30
30
already receiving medical attention should be referred. For
98th
for the phases of puberty described below:
exceptionally heavy or light children BMI should be calculated
91st
29
29
Pre-puberty
In Puberty
Completing Puberty
and plotted.
75th
(Tanner stage 1)
(Tanner stages 2-3)
(Tanner stages 4-5)
28
28
Parent height comparator mid-parental centile)
If both of the
If any of the following:
If any of the following:
The mid-parental centile is the average adult height centile to
following:
Slight deepening of the
Voice full broken
27
27
25th
be expected for all children born of this child’s parents. It
voice
Transit point
9th
incorporates a regression adjustment to allow for the
26
from UK-WHO
26
No signs of pubertal Early pubic or armpit
Moustache and early
2nd
tendency of very tall and short parents to have children with
Delayed
to UK90 data.
development
hair growth
facial hair growth
less extreme heights. Comparing the mid-parental centile
0.4th
25
25
8 9 10 11 12 13 14 15 16 17 18 19 20
with the child’s current height centile can help assess whether
Enlargement of testes
Adult size of penis
Pubic hair stage
the child’s growth is proceeding as expected. The larger the
or penis
with pubic and
24
24
discrepancy between the two, the more likely it is that the
axillary hair
99.6th
Precocious
child has some sort of disordered growth. Most children’s
98th
23
23
What does a measurement in a shaded area mean?
height centiles (nine out of ten) are within ± 2 centile spaces
91st
The chart provides extra guidance about the lower limit
of the mid-parental centile, and only 1 percent will be
22
22
75th
(0.4th centile) for late-maturing boys in pre-puberty and the
discrepant by more than 3 centile spaces.
upper limit (99.6th centile) for early-maturing boys
21
21
completing puberty. If height and weight falls within a
Mid-parental target height
shaded area on the chart, pubertal assessment will be
25th
The mid-parental target height is obtained by plotting the
20
20
required. For boys in pre-puberty, height or weight within the
9th
mid-parental centile on the height chart at age 20 and
lower shaded areas are likely to be normal, particularly if
2nd
reading off the corresponding height. Four boys out of five
19
19
Delayed
height is not markedly discrepant from the mid-parental
0.4th
will have an adult height within ±7 cm of this target height.
8 9 10 11 12 13 14 15 16 17 18 19 20
centile and BMI is within normal limits. Similarly, boys
However predicted adult height (above) is usually closer to
18
18
completing puberty who have measurements in the upper
Mean testicular volume ml)
the child’s final height.
shaded area are usually normal.
17
17
Precocious
Measurement 1
Measurement 2
Measurement 3
Measurement 4
16
16
98th
Recording Date
Recording Date
Recording Date
Recording Date
91st
15
15
Weight
Weight
Weight
Weight
75th
Length/Height
Length/Height
Length/Height
Length/Height
14
14
BMI
BMI
BMI
BMI
Location
Location
Location
Location
13
13
Health worker name
Health worker name
Health worker name
Health worker name
12
12
25th
Measurement 5
Measurement 6
Measurement 7
Measurement 8
Recording Date
Recording Date
Recording Date
Recording Date
9th
11
11
Weight
Weight
Weight
Weight
2nd
10
10
Length/Height
Length/Height
Length/Height
Length/Height
Delayed
Age in years
0.4th
BMI
BMI
BMI
BMI
8 9 10 11 12 13 14 15 16 17 18 19 20
9
9
Location
Location
Location
Location
2
3
4
5
6
7
8
9
10
11
12
13
14
15
16
17
18
19
20
Van Buuren S. Growth charts of human development;
Statistical Methods in Medical Research.
8
8
Health worker name
Health worker name
Health worker name
Health worker name
DOI: 10.1177/0962280212473300
ADVERTISEMENT
0 votes
Related Articles
Related forms
 Growth Chart")


")
")

Related Categories
Parent category: Medical