Kids Count Activity Sheet
ADVERTISEMENT
 1
1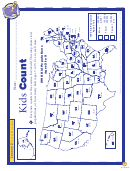 2
2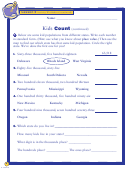 3
3Map Literacy
KIDS COUNT
Grades 3-4
Skills and Objectives:
Students will read a special purpose map.
Chalkboard
Students will use place value to hundred thousands.
Definition
Students will write numbers to hundred thousands.
place value: the value
given to a digit based
Suggested Groupings:
Wrapping Up:
on its place within a
Have students look
Individuals, partners
numeral. For example,
at the We Count! map.
in the number 6,875,
Ask students to list
Getting Started:
6 is in the thousands
the states that have
Introduce the activity by discussing the
place, 8 is in the
the most people. You
importance of counting kids in the census. One
hundreds place, 7 is in
may also wish to
misconception about the census is that kids
the tens place, and 5
provide students with
don’t count. In fact, kids need to be counted so
is in the ones place.
a copy of the Total
that areas with large populations of children
State Population Chart
can get the services they need, like schools, day
from the inside back cover.
care centers, playgrounds, and crossing guards.
Have students use the following map key
Ask students the following questions:
categories —Most, Fewer and Fewest — as a
What kinds of things does a place with a
guide for coloring in their Kids Count maps.
lot of young children need? (Possible answers:
Direct students to choose 3 crayons or colored
schools, day care centers, playgrounds.)
pencils and fill in the box next to each category
with a single color. Then students will color in
How do government agencies know where
each state with the color that corresponds to
these things are needed? (Possible answer:
the appropriate map key category.
they use census data.)
How do the populations shown on the
Using the Activity Worksheets:
We Count! map compare to the population
Distribute copies of the Lesson 2 Activity
of children ages 5-9 for each state?
Worksheets (pages 7 and 8) to your class.
(Students should notice that the states with the
Before they begin working on the Activity
highest populations on the map also have the
Worksheet on page 8, make sure students
greatest number of children ages 5-9.)
understand the information on the map on
Extension Activity:
Help students update
page 7. Explain that it shows the 1990 population
the population totals for children ages 5-9 using
of children ages 5-9 for each state.
information from the U.S. Census Bureau Web
Make sure students realize that they will have
site ( ). Your class can indicate
to refer to the map on page 7 to figure out
whether this population has increased, decreased,
which state’s population is represented.
or stayed the same in each state with the
+
-
=
symbols
,
, or
.)
You may want to review place value and the
proper placement of commas with students.
Answers:
Suggest to students that they create place value
Page 8:
charts to use when completing the exercises.
1. 63,518; Rhode Island.
2. 85,065; Nevada.
Remind students to put zeros in, if necessary,
to hold a place when writing numbers in digits.
3. 211,213; Mississippi.
4. 130,596; New Mexico.
Guide students through the questions on
5. 409,773; Indiana.
page 8, assisting them where necessary, and
6. Answers will vary.
reviewing the answers as a class.
6
D-3273ETG
ADVERTISEMENT
0 votes
Related Articles
Related forms


Related Categories
Parent category: Education